Yugoslavian vs Iraqi Disability Age Under 5
COMPARE
Yugoslavian
Iraqi
Disability Age Under 5
Disability Age Under 5 Comparison
Yugoslavians
Iraqis
1.4%
DISABILITY AGE UNDER 5
0.1/ 100
METRIC RATING
264th/ 347
METRIC RANK
1.2%
DISABILITY AGE UNDER 5
95.1/ 100
METRIC RATING
108th/ 347
METRIC RANK
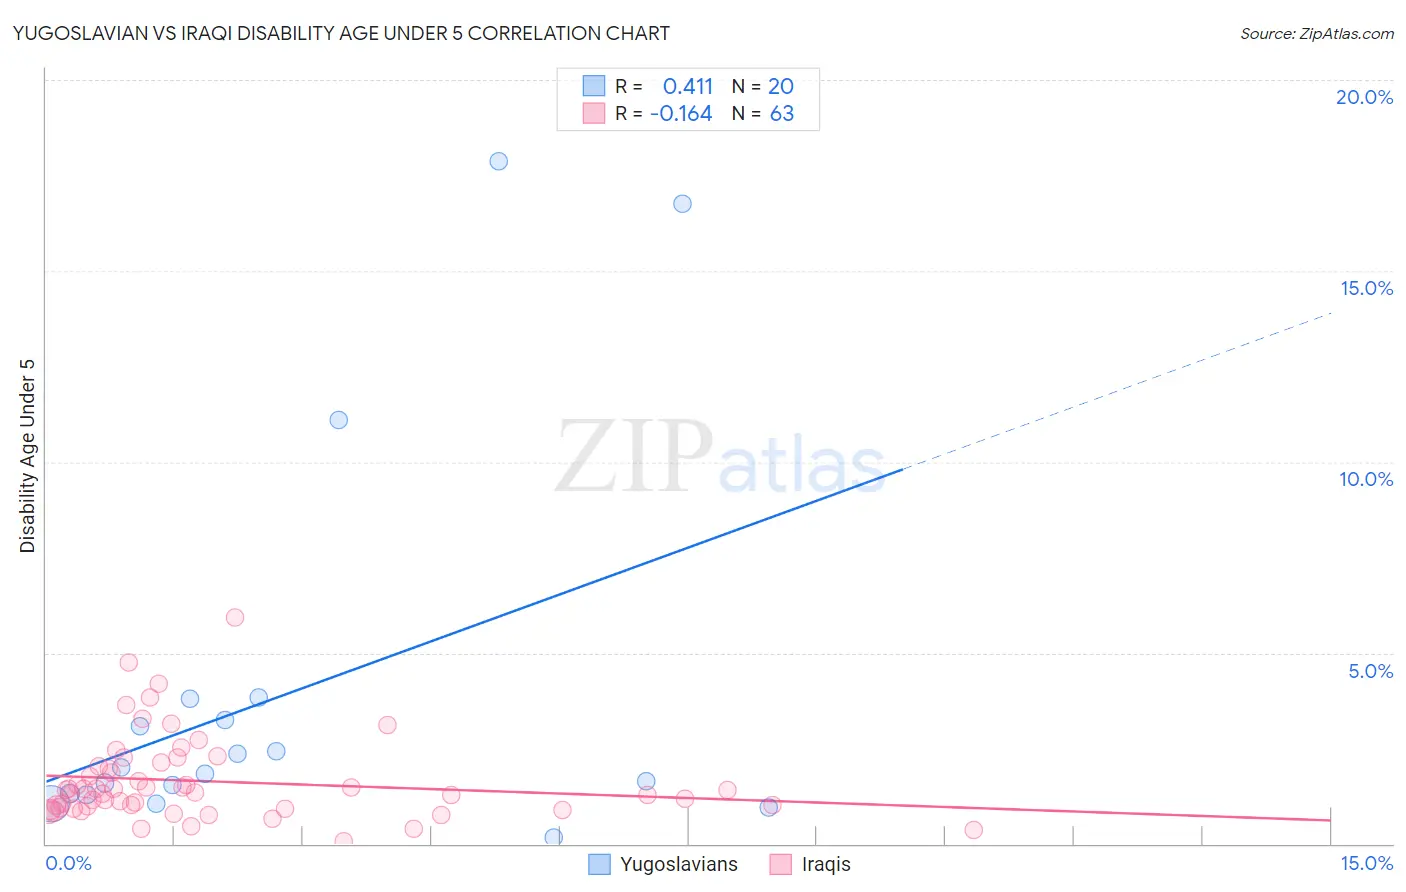
Yugoslavian vs Iraqi Disability Age Under 5 Correlation Chart
The statistical analysis conducted on geographies consisting of 169,705,353 people shows a moderate positive correlation between the proportion of Yugoslavians and percentage of population with a disability under the age of 5 in the United States with a correlation coefficient (R) of 0.411 and weighted average of 1.4%. Similarly, the statistical analysis conducted on geographies consisting of 119,151,918 people shows a poor negative correlation between the proportion of Iraqis and percentage of population with a disability under the age of 5 in the United States with a correlation coefficient (R) of -0.164 and weighted average of 1.2%, a difference of 22.9%.
Disability Age Under 5 Correlation Summary
| Measurement | Yugoslavian | Iraqi |
| Minimum | 0.18% | 0.070% |
| Maximum | 17.9% | 5.9% |
| Range | 17.7% | 5.9% |
| Mean | 3.9% | 1.6% |
| Median | 1.9% | 1.3% |
| Interquartile 25% (IQ1) | 1.3% | 0.92% |
| Interquartile 75% (IQ3) | 3.5% | 2.0% |
| Interquartile Range (IQR) | 2.2% | 1.1% |
| Standard Deviation (Sample) | 5.1% | 1.1% |
| Standard Deviation (Population) | 5.0% | 1.1% |
Similar Demographics by Disability Age Under 5
Demographics Similar to Yugoslavians by Disability Age Under 5
In terms of disability age under 5, the demographic groups most similar to Yugoslavians are Carpatho Rusyn (1.4%, a difference of 0.040%), Immigrants from Germany (1.4%, a difference of 0.080%), Spanish (1.4%, a difference of 0.15%), Immigrants from Dominica (1.4%, a difference of 0.21%), and Immigrants from Netherlands (1.4%, a difference of 0.37%).
| Demographics | Rating | Rank | Disability Age Under 5 |
| Slovenes | 0.3 /100 | #257 | Tragic 1.4% |
| Costa Ricans | 0.3 /100 | #258 | Tragic 1.4% |
| Immigrants | Southern Europe | 0.3 /100 | #259 | Tragic 1.4% |
| Slavs | 0.3 /100 | #260 | Tragic 1.4% |
| Immigrants | Netherlands | 0.2 /100 | #261 | Tragic 1.4% |
| Immigrants | Dominica | 0.2 /100 | #262 | Tragic 1.4% |
| Spanish | 0.2 /100 | #263 | Tragic 1.4% |
| Yugoslavians | 0.1 /100 | #264 | Tragic 1.4% |
| Carpatho Rusyns | 0.1 /100 | #265 | Tragic 1.4% |
| Immigrants | Germany | 0.1 /100 | #266 | Tragic 1.4% |
| Cree | 0.1 /100 | #267 | Tragic 1.4% |
| Belgians | 0.1 /100 | #268 | Tragic 1.4% |
| Austrians | 0.1 /100 | #269 | Tragic 1.4% |
| Immigrants | North America | 0.1 /100 | #270 | Tragic 1.4% |
| Immigrants | Canada | 0.1 /100 | #271 | Tragic 1.4% |
Demographics Similar to Iraqis by Disability Age Under 5
In terms of disability age under 5, the demographic groups most similar to Iraqis are Immigrants from Panama (1.2%, a difference of 0.020%), Immigrants from Lebanon (1.2%, a difference of 0.040%), Immigrants from West Indies (1.2%, a difference of 0.13%), Cambodian (1.2%, a difference of 0.17%), and Senegalese (1.2%, a difference of 0.24%).
| Demographics | Rating | Rank | Disability Age Under 5 |
| Immigrants | Uganda | 96.1 /100 | #101 | Exceptional 1.1% |
| Immigrants | Morocco | 96.0 /100 | #102 | Exceptional 1.2% |
| Immigrants | Nicaragua | 96.0 /100 | #103 | Exceptional 1.2% |
| Indonesians | 95.9 /100 | #104 | Exceptional 1.2% |
| Immigrants | South Africa | 95.6 /100 | #105 | Exceptional 1.2% |
| Cambodians | 95.4 /100 | #106 | Exceptional 1.2% |
| Immigrants | West Indies | 95.3 /100 | #107 | Exceptional 1.2% |
| Iraqis | 95.1 /100 | #108 | Exceptional 1.2% |
| Immigrants | Panama | 95.0 /100 | #109 | Exceptional 1.2% |
| Immigrants | Lebanon | 95.0 /100 | #110 | Exceptional 1.2% |
| Senegalese | 94.6 /100 | #111 | Exceptional 1.2% |
| Immigrants | Australia | 94.4 /100 | #112 | Exceptional 1.2% |
| Immigrants | Oceania | 94.2 /100 | #113 | Exceptional 1.2% |
| Belizeans | 93.9 /100 | #114 | Exceptional 1.2% |
| Immigrants | Caribbean | 93.8 /100 | #115 | Exceptional 1.2% |