Yaqui vs Asian Hearing Disability
COMPARE
Yaqui
Asian
Hearing Disability
Hearing Disability Comparison
Yaqui
Asians
3.4%
HEARING DISABILITY
0.2/ 100
METRIC RATING
257th/ 347
METRIC RANK
2.7%
HEARING DISABILITY
97.5/ 100
METRIC RATING
76th/ 347
METRIC RANK
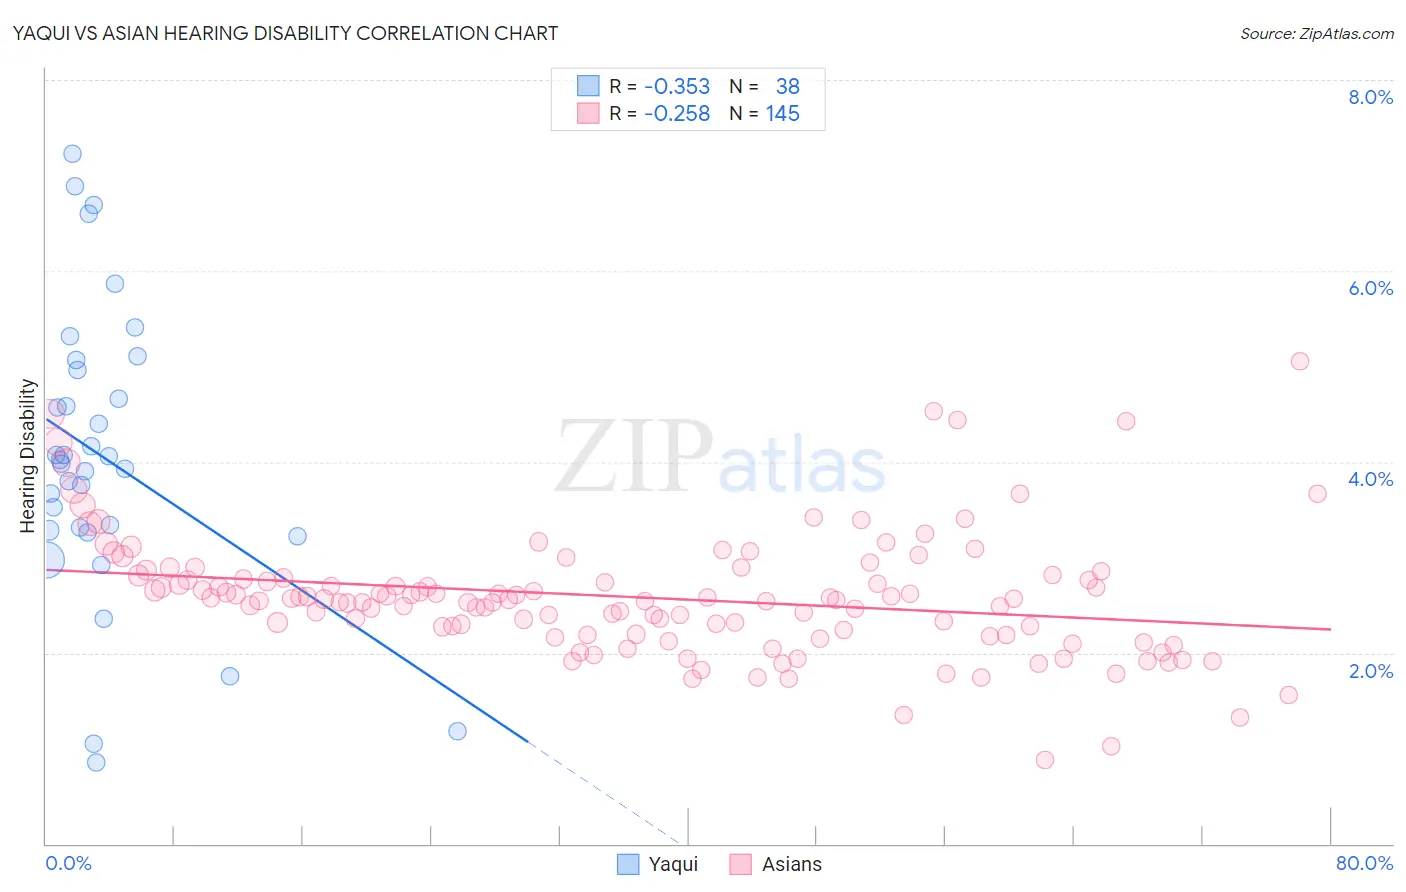
Yaqui vs Asian Hearing Disability Correlation Chart
The statistical analysis conducted on geographies consisting of 107,718,352 people shows a mild negative correlation between the proportion of Yaqui and percentage of population with hearing disability in the United States with a correlation coefficient (R) of -0.353 and weighted average of 3.4%. Similarly, the statistical analysis conducted on geographies consisting of 550,340,322 people shows a weak negative correlation between the proportion of Asians and percentage of population with hearing disability in the United States with a correlation coefficient (R) of -0.258 and weighted average of 2.7%, a difference of 25.9%.
Hearing Disability Correlation Summary
| Measurement | Yaqui | Asian |
| Minimum | 0.85% | 0.87% |
| Maximum | 7.2% | 5.1% |
| Range | 6.4% | 4.2% |
| Mean | 4.0% | 2.6% |
| Median | 4.0% | 2.6% |
| Interquartile 25% (IQ1) | 3.3% | 2.2% |
| Interquartile 75% (IQ3) | 5.0% | 2.8% |
| Interquartile Range (IQR) | 1.7% | 0.60% |
| Standard Deviation (Sample) | 1.5% | 0.65% |
| Standard Deviation (Population) | 1.5% | 0.65% |
Similar Demographics by Hearing Disability
Demographics Similar to Yaqui by Hearing Disability
In terms of hearing disability, the demographic groups most similar to Yaqui are Northern European (3.4%, a difference of 0.070%), Slovene (3.5%, a difference of 0.30%), Portuguese (3.5%, a difference of 0.38%), Hawaiian (3.5%, a difference of 0.42%), and Hmong (3.4%, a difference of 0.45%).
| Demographics | Rating | Rank | Hearing Disability |
| Yuman | 0.4 /100 | #250 | Tragic 3.4% |
| Hungarians | 0.4 /100 | #251 | Tragic 3.4% |
| Croatians | 0.4 /100 | #252 | Tragic 3.4% |
| Carpatho Rusyns | 0.3 /100 | #253 | Tragic 3.4% |
| Slavs | 0.2 /100 | #254 | Tragic 3.4% |
| Poles | 0.2 /100 | #255 | Tragic 3.4% |
| Hmong | 0.2 /100 | #256 | Tragic 3.4% |
| Yaqui | 0.2 /100 | #257 | Tragic 3.4% |
| Northern Europeans | 0.2 /100 | #258 | Tragic 3.4% |
| Slovenes | 0.1 /100 | #259 | Tragic 3.5% |
| Portuguese | 0.1 /100 | #260 | Tragic 3.5% |
| Hawaiians | 0.1 /100 | #261 | Tragic 3.5% |
| Immigrants | North America | 0.1 /100 | #262 | Tragic 3.5% |
| Immigrants | Canada | 0.1 /100 | #263 | Tragic 3.5% |
| Immigrants | Germany | 0.1 /100 | #264 | Tragic 3.5% |
Demographics Similar to Asians by Hearing Disability
In terms of hearing disability, the demographic groups most similar to Asians are Immigrants from Saudi Arabia (2.7%, a difference of 0.0%), Immigrants from Malaysia (2.7%, a difference of 0.020%), Argentinean (2.7%, a difference of 0.030%), Immigrants from Korea (2.7%, a difference of 0.030%), and Mongolian (2.7%, a difference of 0.070%).
| Demographics | Rating | Rank | Hearing Disability |
| Nicaraguans | 97.9 /100 | #69 | Exceptional 2.7% |
| Peruvians | 97.7 /100 | #70 | Exceptional 2.7% |
| Central Americans | 97.7 /100 | #71 | Exceptional 2.7% |
| Afghans | 97.6 /100 | #72 | Exceptional 2.7% |
| Argentineans | 97.5 /100 | #73 | Exceptional 2.7% |
| Immigrants | Korea | 97.5 /100 | #74 | Exceptional 2.7% |
| Immigrants | Saudi Arabia | 97.5 /100 | #75 | Exceptional 2.7% |
| Asians | 97.5 /100 | #76 | Exceptional 2.7% |
| Immigrants | Malaysia | 97.5 /100 | #77 | Exceptional 2.7% |
| Mongolians | 97.4 /100 | #78 | Exceptional 2.7% |
| Colombians | 97.4 /100 | #79 | Exceptional 2.7% |
| Immigrants | Asia | 97.2 /100 | #80 | Exceptional 2.7% |
| Immigrants | Uruguay | 97.2 /100 | #81 | Exceptional 2.7% |
| Immigrants | Armenia | 97.2 /100 | #82 | Exceptional 2.7% |
| Immigrants | Cuba | 97.2 /100 | #83 | Exceptional 2.7% |