Yaqui vs Marshallese Disability Age Under 5
COMPARE
Yaqui
Marshallese
Disability Age Under 5
Disability Age Under 5 Comparison
Yaqui
Marshallese
1.2%
DISABILITY AGE UNDER 5
74.8/ 100
METRIC RATING
151st/ 347
METRIC RANK
0.94%
DISABILITY AGE UNDER 5
100.0/ 100
METRIC RATING
10th/ 347
METRIC RANK
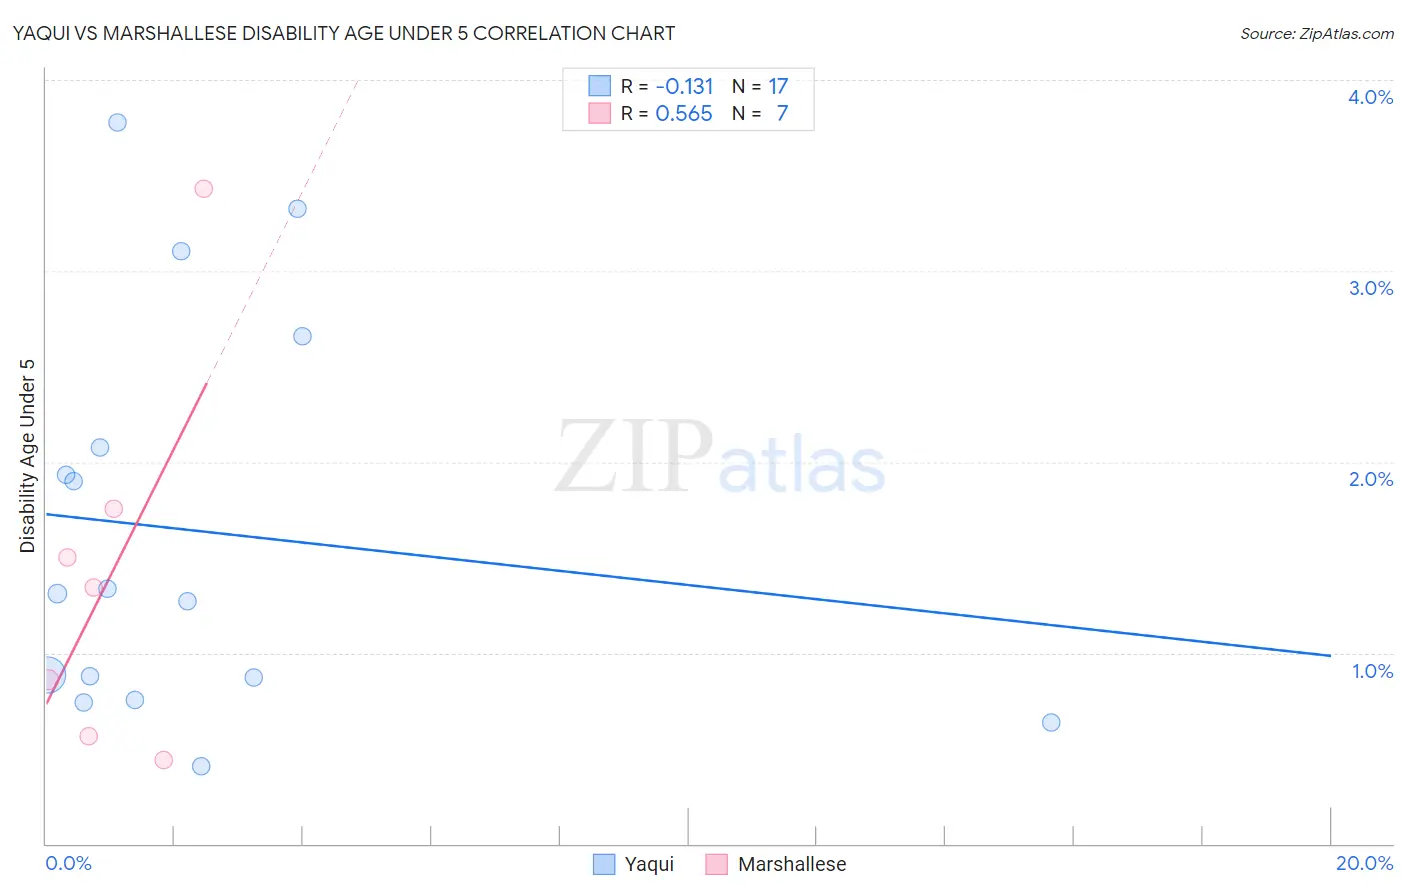
Yaqui vs Marshallese Disability Age Under 5 Correlation Chart
The statistical analysis conducted on geographies consisting of 82,785,563 people shows a poor negative correlation between the proportion of Yaqui and percentage of population with a disability under the age of 5 in the United States with a correlation coefficient (R) of -0.131 and weighted average of 1.2%. Similarly, the statistical analysis conducted on geographies consisting of 12,862,689 people shows a substantial positive correlation between the proportion of Marshallese and percentage of population with a disability under the age of 5 in the United States with a correlation coefficient (R) of 0.565 and weighted average of 0.94%, a difference of 29.1%.
Disability Age Under 5 Correlation Summary
| Measurement | Yaqui | Marshallese |
| Minimum | 0.41% | 0.44% |
| Maximum | 3.8% | 3.4% |
| Range | 3.4% | 3.0% |
| Mean | 1.6% | 1.4% |
| Median | 1.3% | 1.3% |
| Interquartile 25% (IQ1) | 0.81% | 0.56% |
| Interquartile 75% (IQ3) | 2.4% | 1.8% |
| Interquartile Range (IQR) | 1.6% | 1.2% |
| Standard Deviation (Sample) | 1.0% | 1.0% |
| Standard Deviation (Population) | 1.0% | 0.94% |
Similar Demographics by Disability Age Under 5
Demographics Similar to Yaqui by Disability Age Under 5
In terms of disability age under 5, the demographic groups most similar to Yaqui are South American (1.2%, a difference of 0.10%), Kenyan (1.2%, a difference of 0.14%), Ghanaian (1.2%, a difference of 0.19%), Icelander (1.2%, a difference of 0.20%), and Honduran (1.2%, a difference of 0.28%).
| Demographics | Rating | Rank | Disability Age Under 5 |
| Immigrants | Middle Africa | 79.3 /100 | #144 | Good 1.2% |
| Immigrants | Zimbabwe | 77.9 /100 | #145 | Good 1.2% |
| Samoans | 77.7 /100 | #146 | Good 1.2% |
| Icelanders | 76.3 /100 | #147 | Good 1.2% |
| Ghanaians | 76.3 /100 | #148 | Good 1.2% |
| Kenyans | 75.9 /100 | #149 | Good 1.2% |
| South Americans | 75.6 /100 | #150 | Good 1.2% |
| Yaqui | 74.8 /100 | #151 | Good 1.2% |
| Hondurans | 72.5 /100 | #152 | Good 1.2% |
| Immigrants | Thailand | 69.4 /100 | #153 | Good 1.2% |
| Uruguayans | 68.8 /100 | #154 | Good 1.2% |
| Immigrants | Ghana | 68.7 /100 | #155 | Good 1.2% |
| Hawaiians | 68.5 /100 | #156 | Good 1.2% |
| Immigrants | South America | 67.0 /100 | #157 | Good 1.2% |
| Arabs | 66.4 /100 | #158 | Good 1.2% |
Demographics Similar to Marshallese by Disability Age Under 5
In terms of disability age under 5, the demographic groups most similar to Marshallese are Afghan (0.94%, a difference of 0.76%), Immigrants from Grenada (0.94%, a difference of 0.78%), Soviet Union (0.95%, a difference of 0.95%), Yuman (0.95%, a difference of 1.0%), and Immigrants from Hong Kong (0.95%, a difference of 1.1%).
| Demographics | Rating | Rank | Disability Age Under 5 |
| Vietnamese | 100.0 /100 | #3 | Exceptional 0.81% |
| Immigrants | Uzbekistan | 100.0 /100 | #4 | Exceptional 0.85% |
| Immigrants | Bangladesh | 100.0 /100 | #5 | Exceptional 0.85% |
| Ute | 100.0 /100 | #6 | Exceptional 0.86% |
| Immigrants | Afghanistan | 100.0 /100 | #7 | Exceptional 0.91% |
| Immigrants | Yemen | 100.0 /100 | #8 | Exceptional 0.91% |
| Immigrants | Fiji | 100.0 /100 | #9 | Exceptional 0.92% |
| Marshallese | 100.0 /100 | #10 | Exceptional 0.94% |
| Afghans | 100.0 /100 | #11 | Exceptional 0.94% |
| Immigrants | Grenada | 100.0 /100 | #12 | Exceptional 0.94% |
| Soviet Union | 100.0 /100 | #13 | Exceptional 0.95% |
| Yuman | 100.0 /100 | #14 | Exceptional 0.95% |
| Immigrants | Hong Kong | 100.0 /100 | #15 | Exceptional 0.95% |
| Immigrants | Israel | 100.0 /100 | #16 | Exceptional 0.96% |
| Immigrants | China | 100.0 /100 | #17 | Exceptional 0.96% |