Yaqui vs Marshallese Unemployment Among Women with Children Under 6 years
COMPARE
Yaqui
Marshallese
Unemployment Among Women with Children Under 6 years
Unemployment Among Women with Children Under 6 years Comparison
Yaqui
Marshallese
8.6%
UNEMPLOYMENT AMONG WOMEN WITH CHILDREN UNDER 6 YEARS
0.0/ 100
METRIC RATING
276th/ 347
METRIC RANK
9.6%
UNEMPLOYMENT AMONG WOMEN WITH CHILDREN UNDER 6 YEARS
0.0/ 100
METRIC RATING
319th/ 347
METRIC RANK
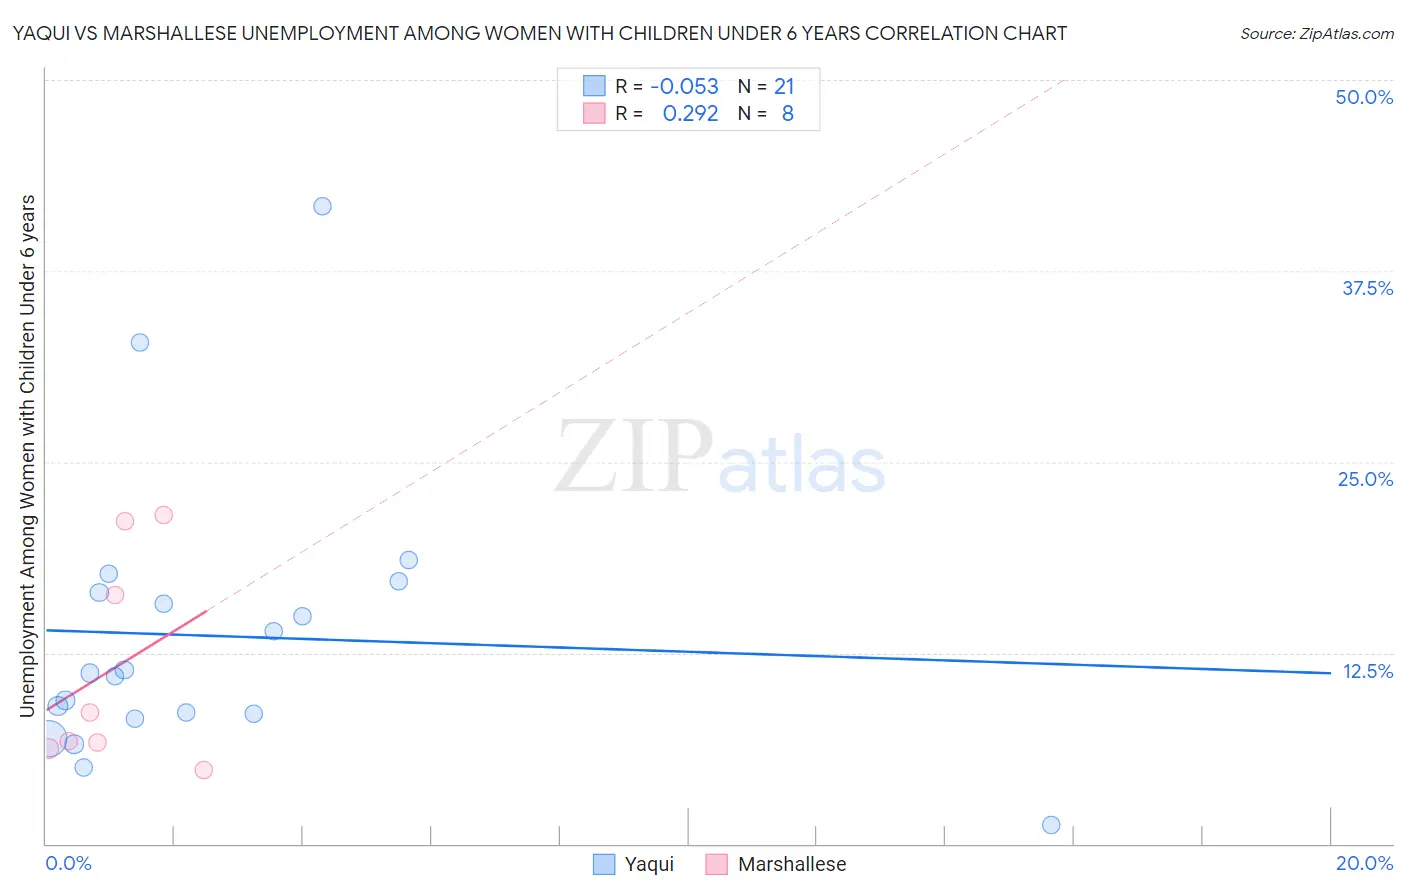
Yaqui vs Marshallese Unemployment Among Women with Children Under 6 years Correlation Chart
The statistical analysis conducted on geographies consisting of 97,750,721 people shows a slight negative correlation between the proportion of Yaqui and unemployment rate among women with children under the age of 6 in the United States with a correlation coefficient (R) of -0.053 and weighted average of 8.6%. Similarly, the statistical analysis conducted on geographies consisting of 13,939,476 people shows a weak positive correlation between the proportion of Marshallese and unemployment rate among women with children under the age of 6 in the United States with a correlation coefficient (R) of 0.292 and weighted average of 9.6%, a difference of 11.2%.
Unemployment Among Women with Children Under 6 years Correlation Summary
| Measurement | Yaqui | Marshallese |
| Minimum | 1.2% | 4.8% |
| Maximum | 41.7% | 21.5% |
| Range | 40.5% | 16.7% |
| Mean | 13.6% | 11.5% |
| Median | 11.2% | 7.7% |
| Interquartile 25% (IQ1) | 8.3% | 6.4% |
| Interquartile 75% (IQ3) | 16.8% | 18.7% |
| Interquartile Range (IQR) | 8.5% | 12.3% |
| Standard Deviation (Sample) | 9.2% | 7.0% |
| Standard Deviation (Population) | 9.0% | 6.6% |
Similar Demographics by Unemployment Among Women with Children Under 6 years
Demographics Similar to Yaqui by Unemployment Among Women with Children Under 6 years
In terms of unemployment among women with children under 6 years, the demographic groups most similar to Yaqui are Haitian (8.6%, a difference of 0.10%), Immigrants from Latin America (8.6%, a difference of 0.34%), Immigrants from Dominica (8.6%, a difference of 0.38%), Immigrants from Guatemala (8.6%, a difference of 0.39%), and Immigrants from Cameroon (8.6%, a difference of 0.40%).
| Demographics | Rating | Rank | Unemployment Among Women with Children Under 6 years |
| Immigrants | Haiti | 0.2 /100 | #269 | Tragic 8.4% |
| Immigrants | Senegal | 0.2 /100 | #270 | Tragic 8.5% |
| Immigrants | Congo | 0.2 /100 | #271 | Tragic 8.5% |
| Mexican American Indians | 0.1 /100 | #272 | Tragic 8.5% |
| Slovaks | 0.1 /100 | #273 | Tragic 8.5% |
| Immigrants | Cameroon | 0.1 /100 | #274 | Tragic 8.6% |
| Immigrants | Latin America | 0.1 /100 | #275 | Tragic 8.6% |
| Yaqui | 0.0 /100 | #276 | Tragic 8.6% |
| Haitians | 0.0 /100 | #277 | Tragic 8.6% |
| Immigrants | Dominica | 0.0 /100 | #278 | Tragic 8.6% |
| Immigrants | Guatemala | 0.0 /100 | #279 | Tragic 8.6% |
| Immigrants | Belize | 0.0 /100 | #280 | Tragic 8.6% |
| Guatemalans | 0.0 /100 | #281 | Tragic 8.7% |
| Bermudans | 0.0 /100 | #282 | Tragic 8.7% |
| Spanish American Indians | 0.0 /100 | #283 | Tragic 8.7% |
Demographics Similar to Marshallese by Unemployment Among Women with Children Under 6 years
In terms of unemployment among women with children under 6 years, the demographic groups most similar to Marshallese are Potawatomi (9.6%, a difference of 0.050%), Central American Indian (9.6%, a difference of 0.11%), Alaska Native (9.6%, a difference of 0.36%), Immigrants from Bahamas (9.6%, a difference of 0.55%), and Osage (9.5%, a difference of 1.0%).
| Demographics | Rating | Rank | Unemployment Among Women with Children Under 6 years |
| Immigrants | Azores | 0.0 /100 | #312 | Tragic 9.2% |
| Americans | 0.0 /100 | #313 | Tragic 9.3% |
| Fijians | 0.0 /100 | #314 | Tragic 9.3% |
| Cherokee | 0.0 /100 | #315 | Tragic 9.3% |
| Houma | 0.0 /100 | #316 | Tragic 9.4% |
| Dutch West Indians | 0.0 /100 | #317 | Tragic 9.5% |
| Osage | 0.0 /100 | #318 | Tragic 9.5% |
| Marshallese | 0.0 /100 | #319 | Tragic 9.6% |
| Potawatomi | 0.0 /100 | #320 | Tragic 9.6% |
| Central American Indians | 0.0 /100 | #321 | Tragic 9.6% |
| Alaska Natives | 0.0 /100 | #322 | Tragic 9.6% |
| Immigrants | Bahamas | 0.0 /100 | #323 | Tragic 9.6% |
| Paiute | 0.0 /100 | #324 | Tragic 9.7% |
| Choctaw | 0.0 /100 | #325 | Tragic 9.8% |
| Delaware | 0.0 /100 | #326 | Tragic 9.8% |