Yaqui vs Celtic Vision Disability
COMPARE
Yaqui
Celtic
Vision Disability
Vision Disability Comparison
Yaqui
Celtics
2.5%
VISION DISABILITY
0.0/ 100
METRIC RATING
293rd/ 347
METRIC RANK
2.4%
VISION DISABILITY
0.1/ 100
METRIC RATING
269th/ 347
METRIC RANK
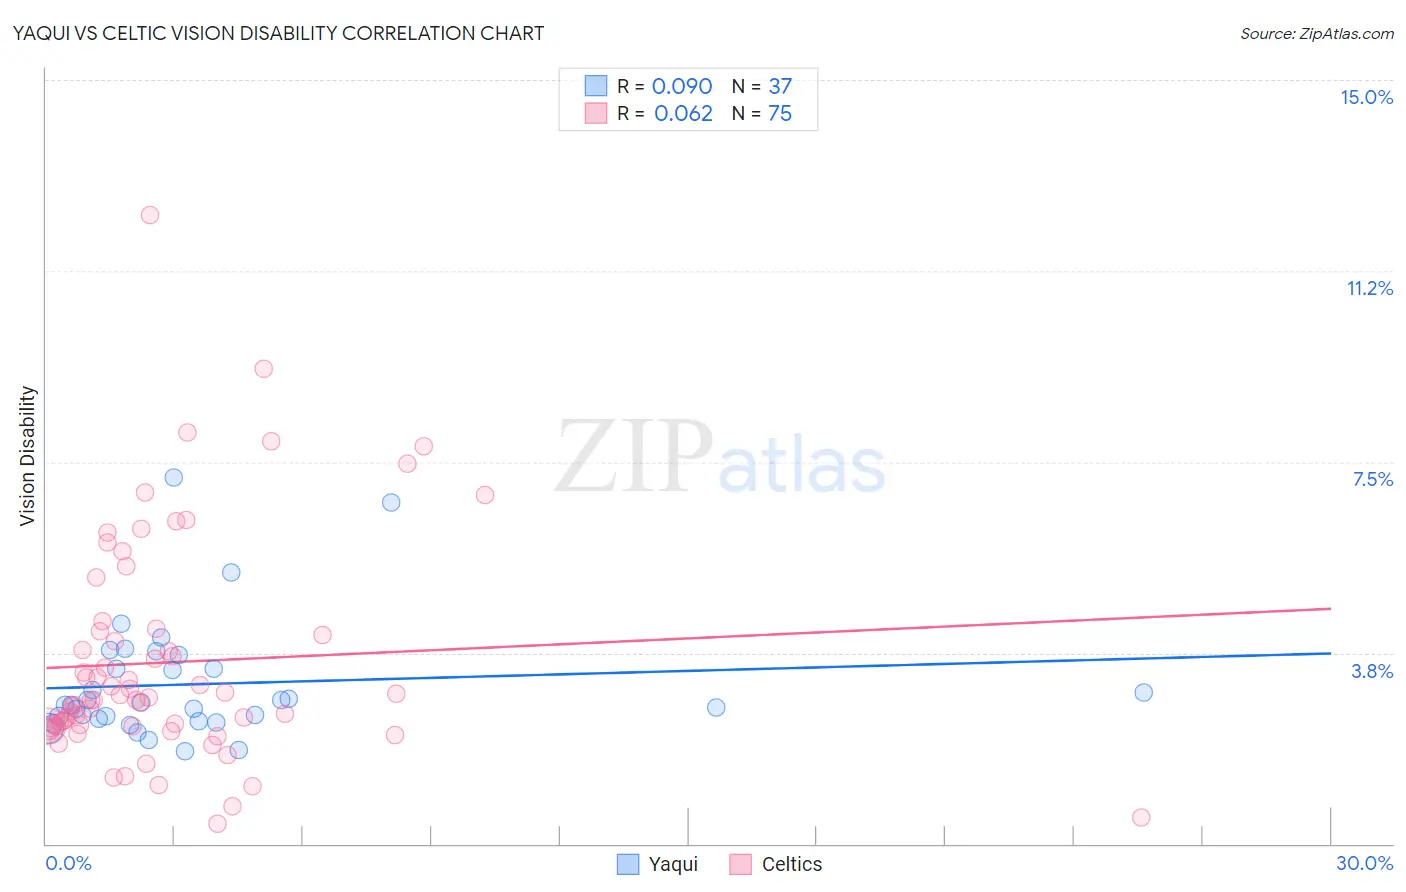
Yaqui vs Celtic Vision Disability Correlation Chart
The statistical analysis conducted on geographies consisting of 107,692,151 people shows a slight positive correlation between the proportion of Yaqui and percentage of population with vision disability in the United States with a correlation coefficient (R) of 0.090 and weighted average of 2.5%. Similarly, the statistical analysis conducted on geographies consisting of 168,807,792 people shows a slight positive correlation between the proportion of Celtics and percentage of population with vision disability in the United States with a correlation coefficient (R) of 0.062 and weighted average of 2.4%, a difference of 3.6%.
Vision Disability Correlation Summary
| Measurement | Yaqui | Celtic |
| Minimum | 1.8% | 0.40% |
| Maximum | 7.2% | 12.3% |
| Range | 5.4% | 11.9% |
| Mean | 3.1% | 3.6% |
| Median | 2.7% | 2.8% |
| Interquartile 25% (IQ1) | 2.4% | 2.3% |
| Interquartile 75% (IQ3) | 3.6% | 4.2% |
| Interquartile Range (IQR) | 1.1% | 1.9% |
| Standard Deviation (Sample) | 1.2% | 2.2% |
| Standard Deviation (Population) | 1.2% | 2.2% |
Similar Demographics by Vision Disability
Demographics Similar to Yaqui by Vision Disability
In terms of vision disability, the demographic groups most similar to Yaqui are Crow (2.5%, a difference of 0.030%), Immigrants from Honduras (2.5%, a difference of 0.12%), Ottawa (2.5%, a difference of 0.34%), Immigrants from Cuba (2.5%, a difference of 0.52%), and Delaware (2.5%, a difference of 0.55%).
| Demographics | Rating | Rank | Vision Disability |
| Sioux | 0.0 /100 | #286 | Tragic 2.5% |
| Hondurans | 0.0 /100 | #287 | Tragic 2.5% |
| French American Indians | 0.0 /100 | #288 | Tragic 2.5% |
| Immigrants | Nonimmigrants | 0.0 /100 | #289 | Tragic 2.5% |
| Immigrants | Cuba | 0.0 /100 | #290 | Tragic 2.5% |
| Immigrants | Honduras | 0.0 /100 | #291 | Tragic 2.5% |
| Crow | 0.0 /100 | #292 | Tragic 2.5% |
| Yaqui | 0.0 /100 | #293 | Tragic 2.5% |
| Ottawa | 0.0 /100 | #294 | Tragic 2.5% |
| Delaware | 0.0 /100 | #295 | Tragic 2.5% |
| Immigrants | Mexico | 0.0 /100 | #296 | Tragic 2.5% |
| Immigrants | Dominica | 0.0 /100 | #297 | Tragic 2.5% |
| Mexicans | 0.0 /100 | #298 | Tragic 2.5% |
| Cree | 0.0 /100 | #299 | Tragic 2.5% |
| Africans | 0.0 /100 | #300 | Tragic 2.5% |
Demographics Similar to Celtics by Vision Disability
In terms of vision disability, the demographic groups most similar to Celtics are Cuban (2.4%, a difference of 0.010%), Immigrants from the Azores (2.4%, a difference of 0.16%), Senegalese (2.4%, a difference of 0.27%), Spaniard (2.4%, a difference of 0.27%), and Ute (2.4%, a difference of 0.36%).
| Demographics | Rating | Rank | Vision Disability |
| Jamaicans | 0.1 /100 | #262 | Tragic 2.4% |
| Immigrants | Belize | 0.1 /100 | #263 | Tragic 2.4% |
| Immigrants | Liberia | 0.1 /100 | #264 | Tragic 2.4% |
| Immigrants | Jamaica | 0.1 /100 | #265 | Tragic 2.4% |
| Mexican American Indians | 0.1 /100 | #266 | Tragic 2.4% |
| Ute | 0.1 /100 | #267 | Tragic 2.4% |
| Senegalese | 0.1 /100 | #268 | Tragic 2.4% |
| Celtics | 0.1 /100 | #269 | Tragic 2.4% |
| Cubans | 0.1 /100 | #270 | Tragic 2.4% |
| Immigrants | Azores | 0.1 /100 | #271 | Tragic 2.4% |
| Spaniards | 0.1 /100 | #272 | Tragic 2.4% |
| Immigrants | Bahamas | 0.1 /100 | #273 | Tragic 2.4% |
| Immigrants | Latin America | 0.0 /100 | #274 | Tragic 2.4% |
| Chippewa | 0.0 /100 | #275 | Tragic 2.4% |
| Scotch-Irish | 0.0 /100 | #276 | Tragic 2.4% |