Alsatian vs Immigrants from El Salvador Vision Disability
COMPARE
Alsatian
Immigrants from El Salvador
Vision Disability
Vision Disability Comparison
Alsatians
Immigrants from El Salvador
2.3%
VISION DISABILITY
0.6/ 100
METRIC RATING
245th/ 347
METRIC RANK
2.2%
VISION DISABILITY
21.0/ 100
METRIC RATING
199th/ 347
METRIC RANK
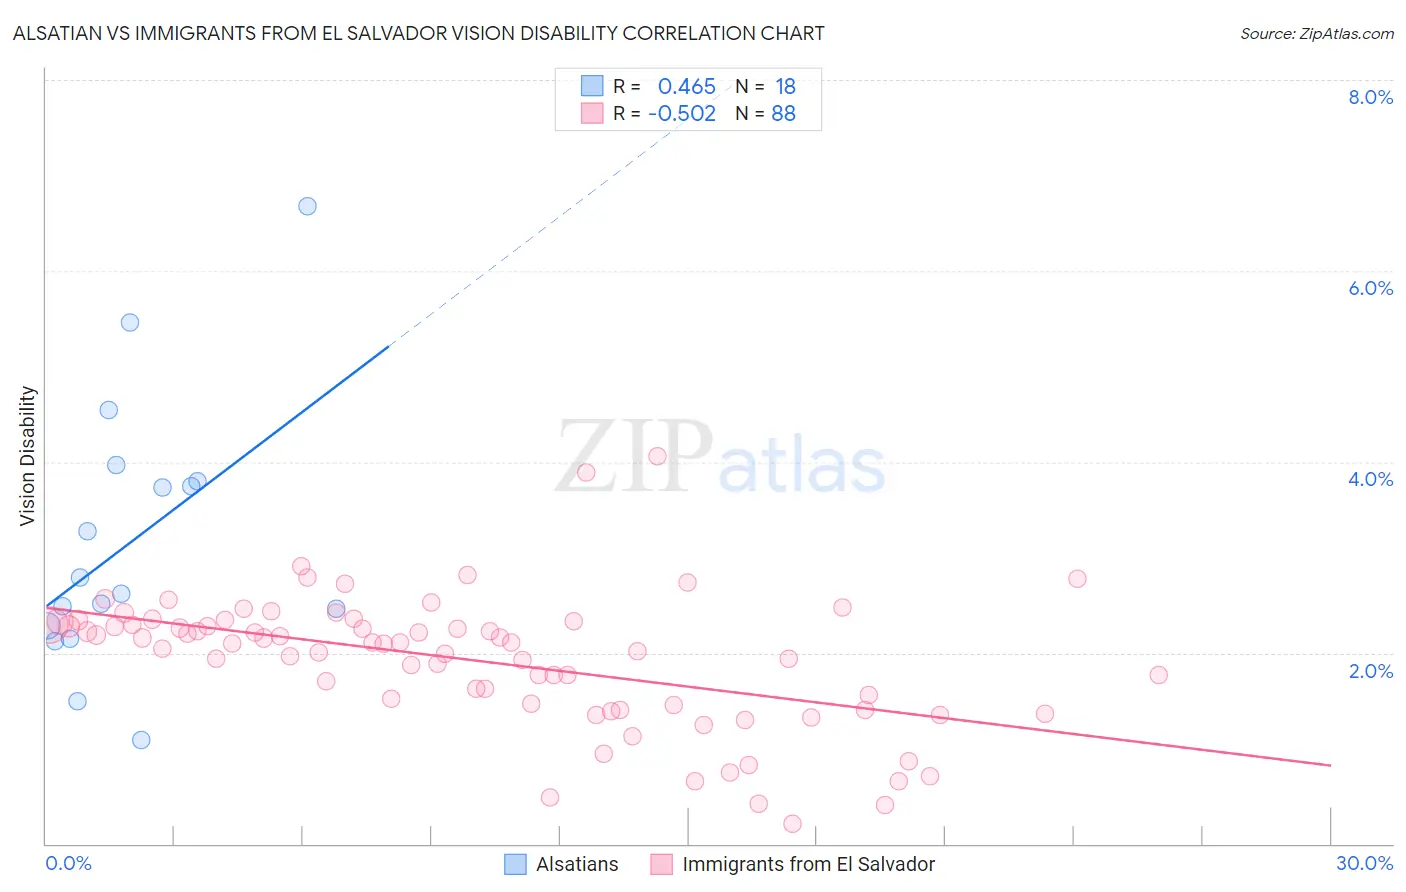
Alsatian vs Immigrants from El Salvador Vision Disability Correlation Chart
The statistical analysis conducted on geographies consisting of 82,677,708 people shows a moderate positive correlation between the proportion of Alsatians and percentage of population with vision disability in the United States with a correlation coefficient (R) of 0.465 and weighted average of 2.3%. Similarly, the statistical analysis conducted on geographies consisting of 357,605,888 people shows a substantial negative correlation between the proportion of Immigrants from El Salvador and percentage of population with vision disability in the United States with a correlation coefficient (R) of -0.502 and weighted average of 2.2%, a difference of 5.9%.
Vision Disability Correlation Summary
| Measurement | Alsatian | Immigrants from El Salvador |
| Minimum | 1.1% | 0.21% |
| Maximum | 6.7% | 4.1% |
| Range | 5.6% | 3.9% |
| Mean | 3.2% | 1.9% |
| Median | 2.7% | 2.1% |
| Interquartile 25% (IQ1) | 2.3% | 1.5% |
| Interquartile 75% (IQ3) | 3.8% | 2.3% |
| Interquartile Range (IQR) | 1.5% | 0.86% |
| Standard Deviation (Sample) | 1.4% | 0.70% |
| Standard Deviation (Population) | 1.4% | 0.69% |
Similar Demographics by Vision Disability
Demographics Similar to Alsatians by Vision Disability
In terms of vision disability, the demographic groups most similar to Alsatians are Immigrants from Nicaragua (2.3%, a difference of 0.090%), Immigrants from West Indies (2.3%, a difference of 0.090%), French (2.3%, a difference of 0.15%), Guatemalan (2.3%, a difference of 0.19%), and Subsaharan African (2.3%, a difference of 0.21%).
| Demographics | Rating | Rank | Vision Disability |
| Immigrants | Cambodia | 1.1 /100 | #238 | Tragic 2.3% |
| English | 1.1 /100 | #239 | Tragic 2.3% |
| Panamanians | 0.9 /100 | #240 | Tragic 2.3% |
| Malaysians | 0.9 /100 | #241 | Tragic 2.3% |
| Immigrants | Panama | 0.8 /100 | #242 | Tragic 2.3% |
| Immigrants | Nicaragua | 0.6 /100 | #243 | Tragic 2.3% |
| Immigrants | West Indies | 0.6 /100 | #244 | Tragic 2.3% |
| Alsatians | 0.6 /100 | #245 | Tragic 2.3% |
| French | 0.5 /100 | #246 | Tragic 2.3% |
| Guatemalans | 0.5 /100 | #247 | Tragic 2.3% |
| Sub-Saharan Africans | 0.5 /100 | #248 | Tragic 2.3% |
| Liberians | 0.5 /100 | #249 | Tragic 2.3% |
| Bangladeshis | 0.5 /100 | #250 | Tragic 2.3% |
| Immigrants | Laos | 0.4 /100 | #251 | Tragic 2.4% |
| Immigrants | Micronesia | 0.3 /100 | #252 | Tragic 2.4% |
Demographics Similar to Immigrants from El Salvador by Vision Disability
In terms of vision disability, the demographic groups most similar to Immigrants from El Salvador are Czechoslovakian (2.2%, a difference of 0.050%), Ghanaian (2.2%, a difference of 0.070%), Immigrants from Thailand (2.2%, a difference of 0.090%), Immigrants from Grenada (2.2%, a difference of 0.18%), and Slovak (2.2%, a difference of 0.21%).
| Demographics | Rating | Rank | Vision Disability |
| Europeans | 25.7 /100 | #192 | Fair 2.2% |
| British | 25.1 /100 | #193 | Fair 2.2% |
| Immigrants | Barbados | 24.0 /100 | #194 | Fair 2.2% |
| Immigrants | Immigrants | 23.7 /100 | #195 | Fair 2.2% |
| Immigrants | Grenada | 23.1 /100 | #196 | Fair 2.2% |
| Ghanaians | 21.8 /100 | #197 | Fair 2.2% |
| Czechoslovakians | 21.6 /100 | #198 | Fair 2.2% |
| Immigrants | El Salvador | 21.0 /100 | #199 | Fair 2.2% |
| Immigrants | Thailand | 20.1 /100 | #200 | Fair 2.2% |
| Slovaks | 18.8 /100 | #201 | Poor 2.2% |
| Immigrants | Zaire | 18.0 /100 | #202 | Poor 2.2% |
| Dutch | 17.1 /100 | #203 | Poor 2.2% |
| Immigrants | Guyana | 15.9 /100 | #204 | Poor 2.2% |
| Samoans | 15.7 /100 | #205 | Poor 2.2% |
| Pennsylvania Germans | 14.5 /100 | #206 | Poor 2.2% |