Yakama vs Israeli Disability Age Over 75
COMPARE
Yakama
Israeli
Disability Age Over 75
Disability Age Over 75 Comparison
Yakama
Israelis
51.3%
DISABILITY AGE OVER 75
0.0/ 100
METRIC RATING
317th/ 347
METRIC RANK
46.4%
DISABILITY AGE OVER 75
97.0/ 100
METRIC RATING
104th/ 347
METRIC RANK
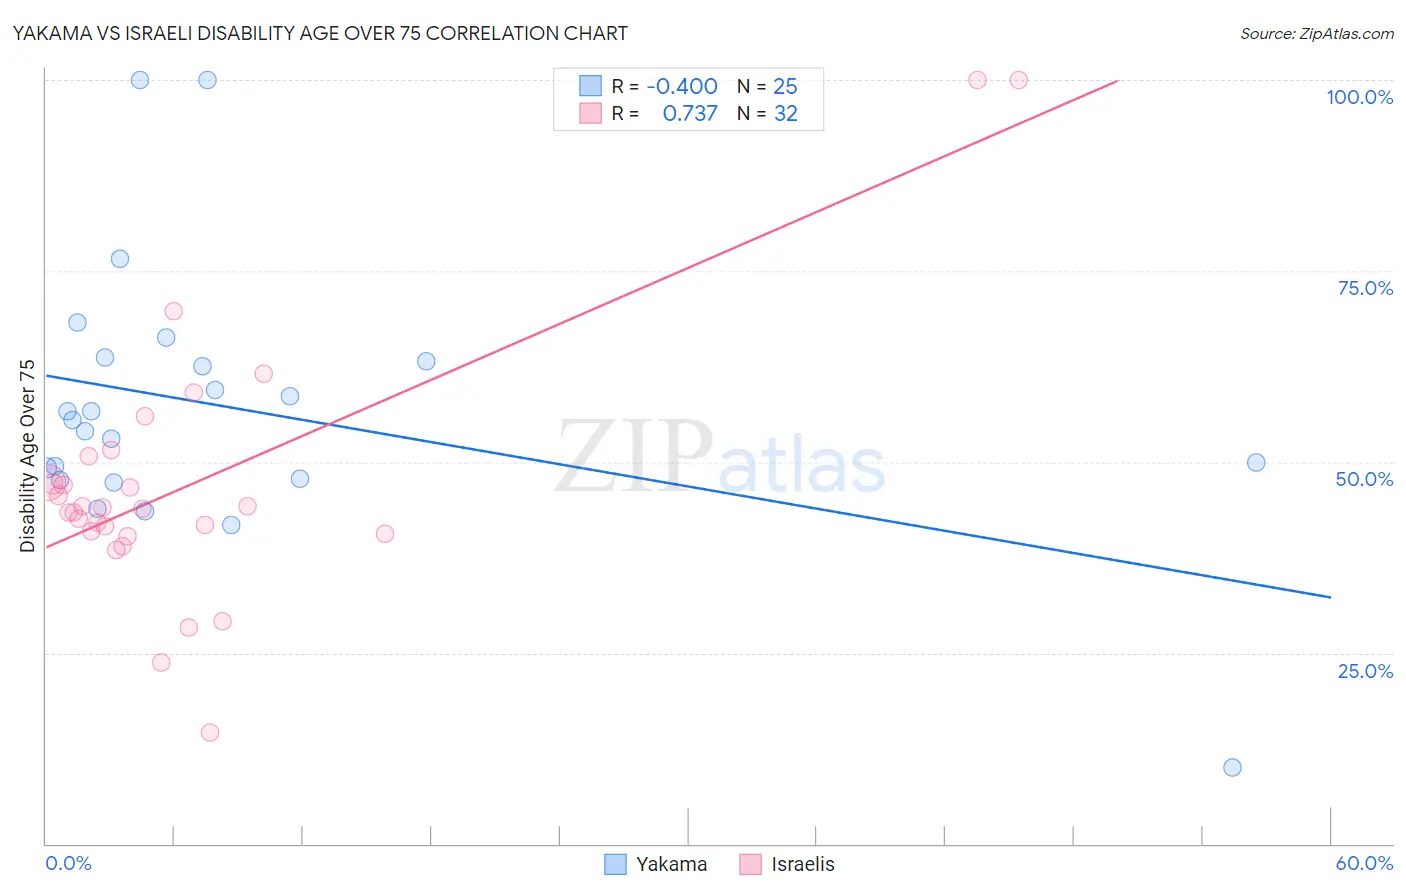
Yakama vs Israeli Disability Age Over 75 Correlation Chart
The statistical analysis conducted on geographies consisting of 19,911,140 people shows a moderate negative correlation between the proportion of Yakama and percentage of population with a disability over the age of 75 in the United States with a correlation coefficient (R) of -0.400 and weighted average of 51.3%. Similarly, the statistical analysis conducted on geographies consisting of 210,857,618 people shows a strong positive correlation between the proportion of Israelis and percentage of population with a disability over the age of 75 in the United States with a correlation coefficient (R) of 0.737 and weighted average of 46.4%, a difference of 10.5%.
Disability Age Over 75 Correlation Summary
| Measurement | Yakama | Israeli |
| Minimum | 10.0% | 14.6% |
| Maximum | 100.0% | 100.0% |
| Range | 90.0% | 85.4% |
| Mean | 57.0% | 47.1% |
| Median | 55.5% | 44.0% |
| Interquartile 25% (IQ1) | 47.8% | 40.7% |
| Interquartile 75% (IQ3) | 63.4% | 49.0% |
| Interquartile Range (IQR) | 15.6% | 8.3% |
| Standard Deviation (Sample) | 17.9% | 17.3% |
| Standard Deviation (Population) | 17.5% | 17.0% |
Similar Demographics by Disability Age Over 75
Demographics Similar to Yakama by Disability Age Over 75
In terms of disability age over 75, the demographic groups most similar to Yakama are Chickasaw (51.2%, a difference of 0.18%), Mexican (51.1%, a difference of 0.32%), Seminole (51.5%, a difference of 0.33%), Creek (51.5%, a difference of 0.33%), and Immigrants from Mexico (51.1%, a difference of 0.37%).
| Demographics | Rating | Rank | Disability Age Over 75 |
| Tlingit-Haida | 0.0 /100 | #310 | Tragic 50.6% |
| Cajuns | 0.0 /100 | #311 | Tragic 50.7% |
| Cheyenne | 0.0 /100 | #312 | Tragic 50.9% |
| Immigrants | Azores | 0.0 /100 | #313 | Tragic 50.9% |
| Immigrants | Mexico | 0.0 /100 | #314 | Tragic 51.1% |
| Mexicans | 0.0 /100 | #315 | Tragic 51.1% |
| Chickasaw | 0.0 /100 | #316 | Tragic 51.2% |
| Yakama | 0.0 /100 | #317 | Tragic 51.3% |
| Seminole | 0.0 /100 | #318 | Tragic 51.5% |
| Creek | 0.0 /100 | #319 | Tragic 51.5% |
| Paiute | 0.0 /100 | #320 | Tragic 51.5% |
| Dutch West Indians | 0.0 /100 | #321 | Tragic 51.5% |
| Comanche | 0.0 /100 | #322 | Tragic 51.7% |
| Immigrants | Yemen | 0.0 /100 | #323 | Tragic 52.0% |
| Menominee | 0.0 /100 | #324 | Tragic 52.3% |
Demographics Similar to Israelis by Disability Age Over 75
In terms of disability age over 75, the demographic groups most similar to Israelis are Immigrants from Malaysia (46.4%, a difference of 0.020%), Ukrainian (46.4%, a difference of 0.020%), Immigrants from Cameroon (46.4%, a difference of 0.020%), Immigrants from Kuwait (46.4%, a difference of 0.040%), and Immigrants from Uruguay (46.4%, a difference of 0.070%).
| Demographics | Rating | Rank | Disability Age Over 75 |
| Finns | 97.9 /100 | #97 | Exceptional 46.3% |
| Immigrants | Japan | 97.8 /100 | #98 | Exceptional 46.3% |
| Palestinians | 97.7 /100 | #99 | Exceptional 46.3% |
| Immigrants | Eastern Europe | 97.7 /100 | #100 | Exceptional 46.3% |
| Mongolians | 97.7 /100 | #101 | Exceptional 46.3% |
| Immigrants | Malaysia | 97.1 /100 | #102 | Exceptional 46.4% |
| Ukrainians | 97.1 /100 | #103 | Exceptional 46.4% |
| Israelis | 97.0 /100 | #104 | Exceptional 46.4% |
| Immigrants | Cameroon | 96.9 /100 | #105 | Exceptional 46.4% |
| Immigrants | Kuwait | 96.8 /100 | #106 | Exceptional 46.4% |
| Immigrants | Uruguay | 96.7 /100 | #107 | Exceptional 46.4% |
| Brazilians | 96.6 /100 | #108 | Exceptional 46.5% |
| Chileans | 96.4 /100 | #109 | Exceptional 46.5% |
| Immigrants | Hong Kong | 96.4 /100 | #110 | Exceptional 46.5% |
| Immigrants | Chile | 96.4 /100 | #111 | Exceptional 46.5% |