Immigrants from Northern Europe vs Greek Cognitive Disability
COMPARE
Immigrants from Northern Europe
Greek
Cognitive Disability
Cognitive Disability Comparison
Immigrants from Northern Europe
Greeks
16.3%
COGNITIVE DISABILITY
100.0/ 100
METRIC RATING
18th/ 347
METRIC RANK
16.4%
COGNITIVE DISABILITY
99.9/ 100
METRIC RATING
36th/ 347
METRIC RANK
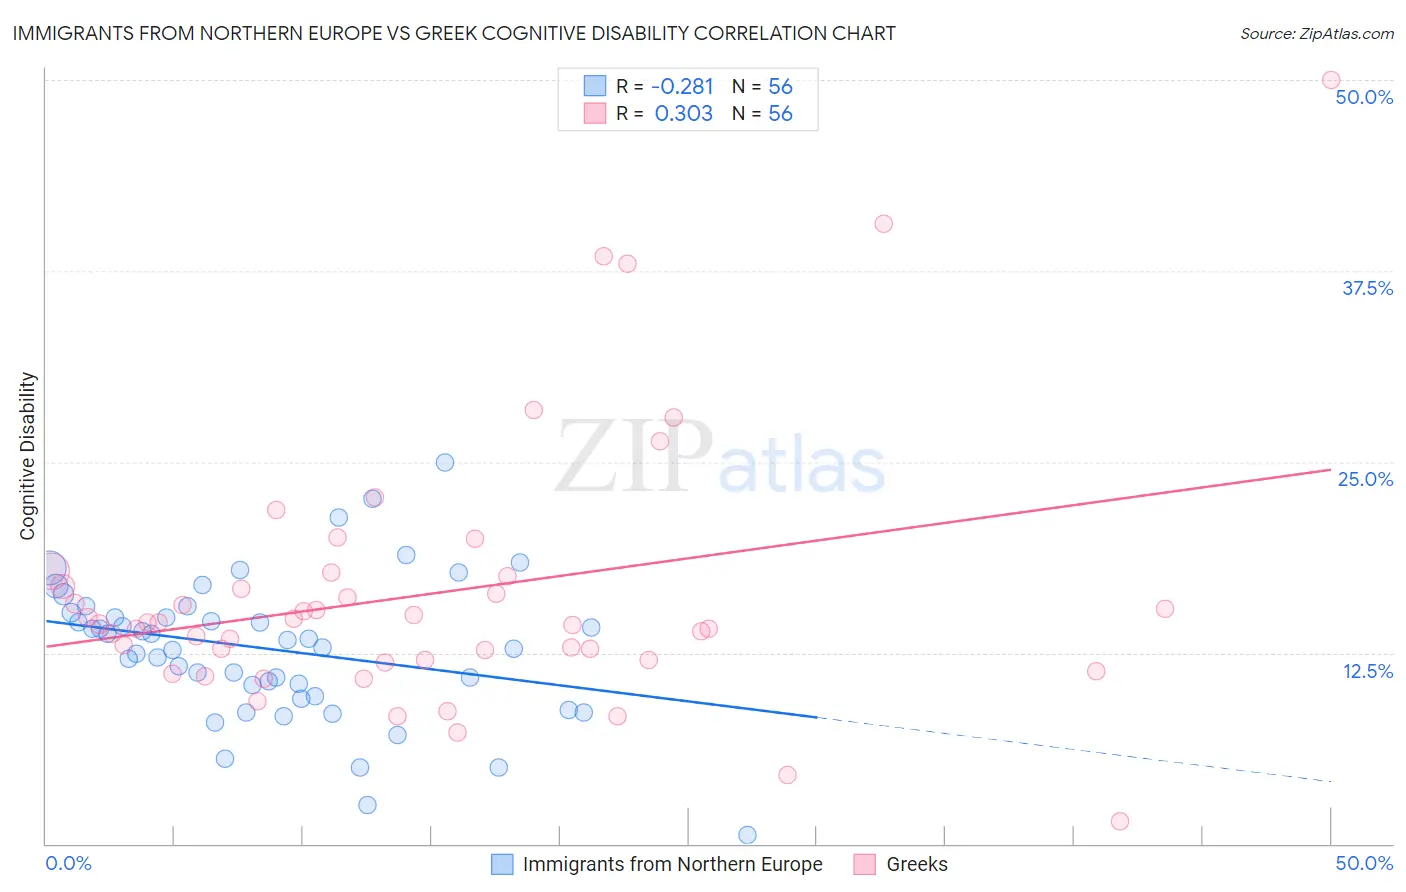
Immigrants from Northern Europe vs Greek Cognitive Disability Correlation Chart
The statistical analysis conducted on geographies consisting of 477,209,929 people shows a weak negative correlation between the proportion of Immigrants from Northern Europe and percentage of population with cognitive disability in the United States with a correlation coefficient (R) of -0.281 and weighted average of 16.3%. Similarly, the statistical analysis conducted on geographies consisting of 482,712,046 people shows a mild positive correlation between the proportion of Greeks and percentage of population with cognitive disability in the United States with a correlation coefficient (R) of 0.303 and weighted average of 16.4%, a difference of 0.61%.
Cognitive Disability Correlation Summary
| Measurement | Immigrants from Northern Europe | Greek |
| Minimum | 0.61% | 1.5% |
| Maximum | 24.9% | 50.0% |
| Range | 24.3% | 48.5% |
| Mean | 12.7% | 16.4% |
| Median | 13.1% | 14.4% |
| Interquartile 25% (IQ1) | 10.0% | 12.0% |
| Interquartile 75% (IQ3) | 15.0% | 17.2% |
| Interquartile Range (IQR) | 5.0% | 5.2% |
| Standard Deviation (Sample) | 4.6% | 8.7% |
| Standard Deviation (Population) | 4.6% | 8.6% |
Demographics Similar to Immigrants from Northern Europe and Greeks by Cognitive Disability
In terms of cognitive disability, the demographic groups most similar to Immigrants from Northern Europe are Immigrants from Bolivia (16.3%, a difference of 0.0%), Bulgarian (16.3%, a difference of 0.020%), Immigrants from North Macedonia (16.3%, a difference of 0.060%), Immigrants from Cuba (16.3%, a difference of 0.060%), and Immigrants from South Central Asia (16.4%, a difference of 0.19%). Similarly, the demographic groups most similar to Greeks are Slovak (16.4%, a difference of 0.010%), Italian (16.4%, a difference of 0.090%), Russian (16.4%, a difference of 0.090%), Slovene (16.5%, a difference of 0.15%), and Immigrants from Israel (16.4%, a difference of 0.16%).
| Demographics | Rating | Rank | Cognitive Disability |
| Immigrants | North Macedonia | 100.0 /100 | #17 | Exceptional 16.3% |
| Immigrants | Northern Europe | 100.0 /100 | #18 | Exceptional 16.3% |
| Immigrants | Bolivia | 100.0 /100 | #19 | Exceptional 16.3% |
| Bulgarians | 100.0 /100 | #20 | Exceptional 16.3% |
| Immigrants | Cuba | 100.0 /100 | #21 | Exceptional 16.3% |
| Immigrants | South Central Asia | 99.9 /100 | #22 | Exceptional 16.4% |
| Croatians | 99.9 /100 | #23 | Exceptional 16.4% |
| Immigrants | Argentina | 99.9 /100 | #24 | Exceptional 16.4% |
| Luxembourgers | 99.9 /100 | #25 | Exceptional 16.4% |
| Immigrants | Croatia | 99.9 /100 | #26 | Exceptional 16.4% |
| Immigrants | Pakistan | 99.9 /100 | #27 | Exceptional 16.4% |
| Poles | 99.9 /100 | #28 | Exceptional 16.4% |
| Filipinos | 99.9 /100 | #29 | Exceptional 16.4% |
| Czechs | 99.9 /100 | #30 | Exceptional 16.4% |
| Immigrants | Romania | 99.9 /100 | #31 | Exceptional 16.4% |
| Immigrants | Israel | 99.9 /100 | #32 | Exceptional 16.4% |
| Italians | 99.9 /100 | #33 | Exceptional 16.4% |
| Russians | 99.9 /100 | #34 | Exceptional 16.4% |
| Slovaks | 99.9 /100 | #35 | Exceptional 16.4% |
| Greeks | 99.9 /100 | #36 | Exceptional 16.4% |
| Slovenes | 99.9 /100 | #37 | Exceptional 16.5% |