West Indian vs Immigrants from Egypt Hearing Disability
COMPARE
West Indian
Immigrants from Egypt
Hearing Disability
Hearing Disability Comparison
West Indians
Immigrants from Egypt
2.6%
HEARING DISABILITY
99.4/ 100
METRIC RATING
42nd/ 347
METRIC RANK
2.7%
HEARING DISABILITY
98.5/ 100
METRIC RATING
60th/ 347
METRIC RANK
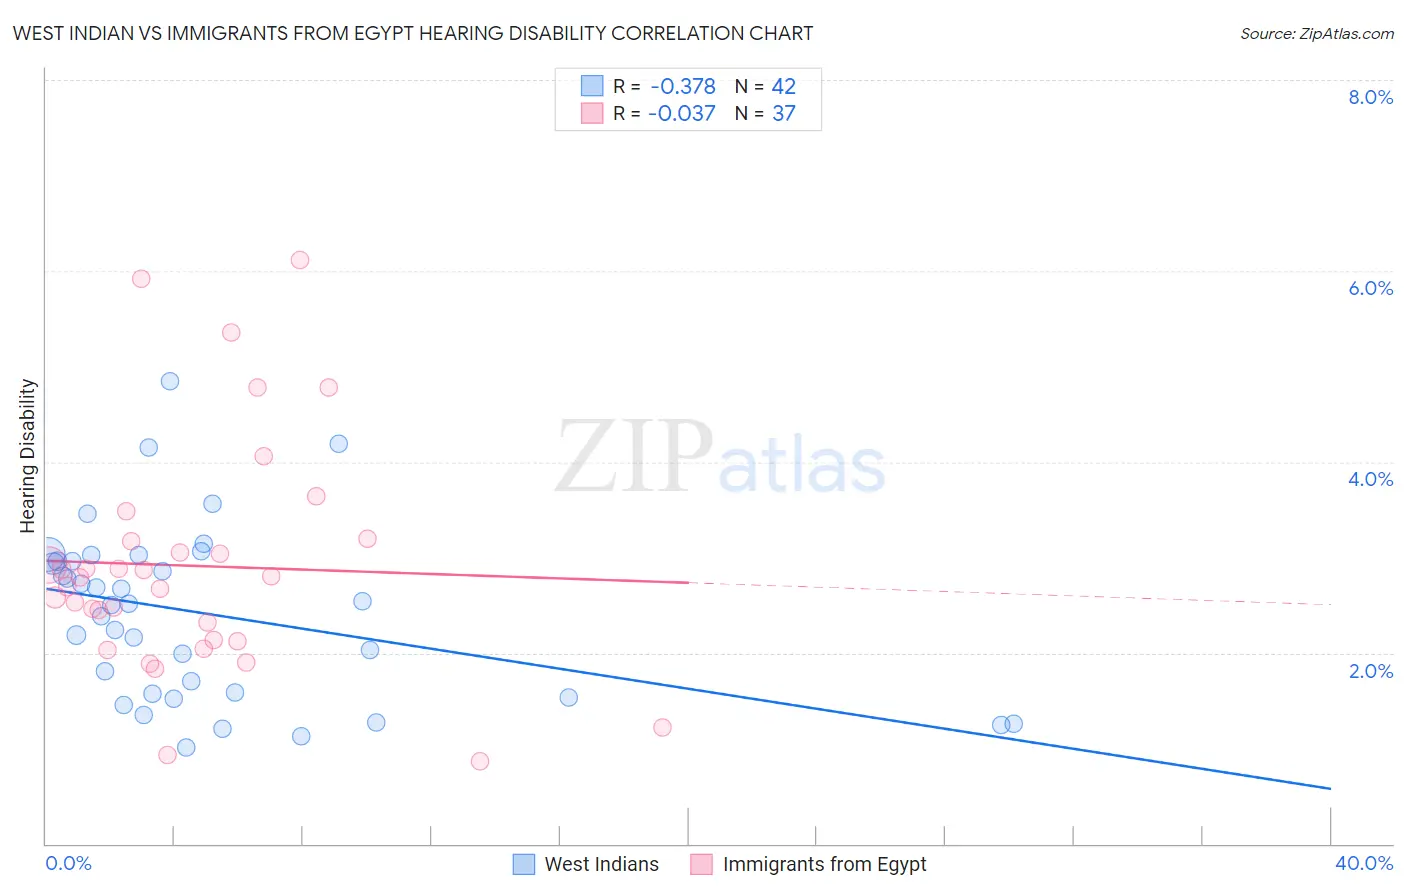
West Indian vs Immigrants from Egypt Hearing Disability Correlation Chart
The statistical analysis conducted on geographies consisting of 253,938,353 people shows a mild negative correlation between the proportion of West Indians and percentage of population with hearing disability in the United States with a correlation coefficient (R) of -0.378 and weighted average of 2.6%. Similarly, the statistical analysis conducted on geographies consisting of 245,432,770 people shows no correlation between the proportion of Immigrants from Egypt and percentage of population with hearing disability in the United States with a correlation coefficient (R) of -0.037 and weighted average of 2.7%, a difference of 2.5%.
Hearing Disability Correlation Summary
| Measurement | West Indian | Immigrants from Egypt |
| Minimum | 1.0% | 0.86% |
| Maximum | 4.8% | 6.1% |
| Range | 3.8% | 5.3% |
| Mean | 2.4% | 2.9% |
| Median | 2.5% | 2.8% |
| Interquartile 25% (IQ1) | 1.6% | 2.1% |
| Interquartile 75% (IQ3) | 3.0% | 3.2% |
| Interquartile Range (IQR) | 1.4% | 1.1% |
| Standard Deviation (Sample) | 0.91% | 1.2% |
| Standard Deviation (Population) | 0.90% | 1.2% |
Demographics Similar to West Indians and Immigrants from Egypt by Hearing Disability
In terms of hearing disability, the demographic groups most similar to West Indians are Immigrants from Taiwan (2.6%, a difference of 0.010%), Senegalese (2.6%, a difference of 0.010%), Nigerian (2.6%, a difference of 0.23%), Venezuelan (2.6%, a difference of 0.25%), and Immigrants from Dominica (2.6%, a difference of 0.36%). Similarly, the demographic groups most similar to Immigrants from Egypt are Immigrants from Eritrea (2.7%, a difference of 0.070%), Immigrants from Uzbekistan (2.7%, a difference of 0.13%), Immigrants from Peru (2.7%, a difference of 0.18%), South American (2.7%, a difference of 0.95%), and Immigrants from Nicaragua (2.7%, a difference of 0.99%).
| Demographics | Rating | Rank | Hearing Disability |
| Immigrants | Taiwan | 99.4 /100 | #41 | Exceptional 2.6% |
| West Indians | 99.4 /100 | #42 | Exceptional 2.6% |
| Senegalese | 99.4 /100 | #43 | Exceptional 2.6% |
| Nigerians | 99.4 /100 | #44 | Exceptional 2.6% |
| Venezuelans | 99.4 /100 | #45 | Exceptional 2.6% |
| Immigrants | Dominica | 99.3 /100 | #46 | Exceptional 2.6% |
| Immigrants | Israel | 99.3 /100 | #47 | Exceptional 2.6% |
| Immigrants | Singapore | 99.3 /100 | #48 | Exceptional 2.6% |
| Immigrants | South America | 99.2 /100 | #49 | Exceptional 2.7% |
| Paraguayans | 99.2 /100 | #50 | Exceptional 2.7% |
| Immigrants | Hong Kong | 99.2 /100 | #51 | Exceptional 2.7% |
| Jamaicans | 99.0 /100 | #52 | Exceptional 2.7% |
| Immigrants | Eastern Asia | 99.0 /100 | #53 | Exceptional 2.7% |
| Ethiopians | 99.0 /100 | #54 | Exceptional 2.7% |
| Immigrants | Ethiopia | 99.0 /100 | #55 | Exceptional 2.7% |
| Immigrants | Nicaragua | 99.0 /100 | #56 | Exceptional 2.7% |
| South Americans | 99.0 /100 | #57 | Exceptional 2.7% |
| Immigrants | Peru | 98.6 /100 | #58 | Exceptional 2.7% |
| Immigrants | Eritrea | 98.5 /100 | #59 | Exceptional 2.7% |
| Immigrants | Egypt | 98.5 /100 | #60 | Exceptional 2.7% |
| Immigrants | Uzbekistan | 98.4 /100 | #61 | Exceptional 2.7% |