West Indian vs Slovak Hearing Disability
COMPARE
West Indian
Slovak
Hearing Disability
Hearing Disability Comparison
West Indians
Slovaks
2.6%
HEARING DISABILITY
99.4/ 100
METRIC RATING
42nd/ 347
METRIC RANK
3.6%
HEARING DISABILITY
0.0/ 100
METRIC RATING
279th/ 347
METRIC RANK
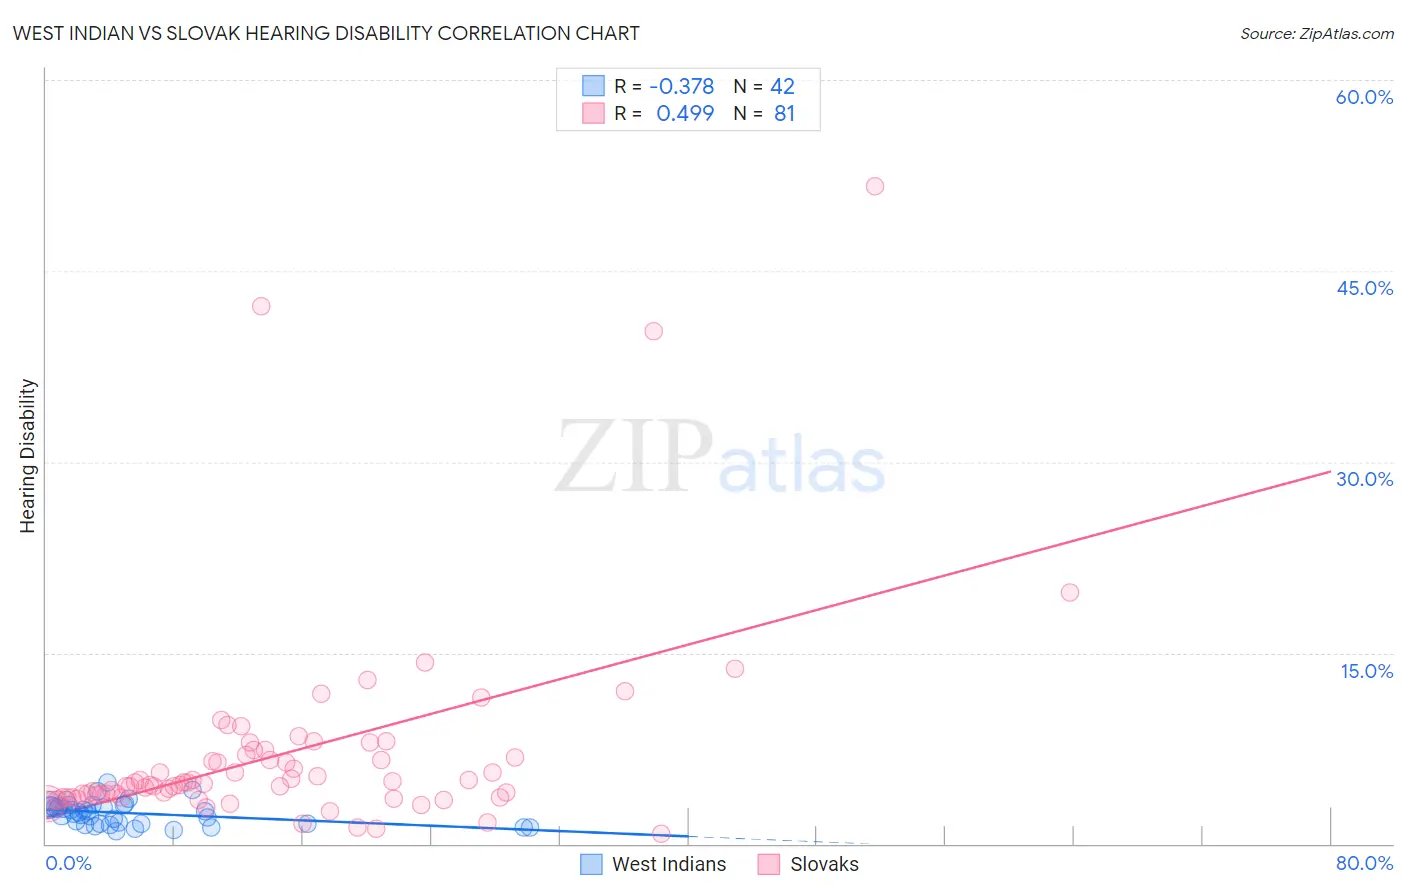
West Indian vs Slovak Hearing Disability Correlation Chart
The statistical analysis conducted on geographies consisting of 253,938,353 people shows a mild negative correlation between the proportion of West Indians and percentage of population with hearing disability in the United States with a correlation coefficient (R) of -0.378 and weighted average of 2.6%. Similarly, the statistical analysis conducted on geographies consisting of 397,764,457 people shows a moderate positive correlation between the proportion of Slovaks and percentage of population with hearing disability in the United States with a correlation coefficient (R) of 0.499 and weighted average of 3.6%, a difference of 36.8%.
Hearing Disability Correlation Summary
| Measurement | West Indian | Slovak |
| Minimum | 1.0% | 0.74% |
| Maximum | 4.8% | 51.6% |
| Range | 3.8% | 50.9% |
| Mean | 2.4% | 7.1% |
| Median | 2.5% | 4.7% |
| Interquartile 25% (IQ1) | 1.6% | 3.7% |
| Interquartile 75% (IQ3) | 3.0% | 7.1% |
| Interquartile Range (IQR) | 1.4% | 3.5% |
| Standard Deviation (Sample) | 0.91% | 8.1% |
| Standard Deviation (Population) | 0.90% | 8.1% |
Similar Demographics by Hearing Disability
Demographics Similar to West Indians by Hearing Disability
In terms of hearing disability, the demographic groups most similar to West Indians are Immigrants from Taiwan (2.6%, a difference of 0.010%), Senegalese (2.6%, a difference of 0.010%), Nigerian (2.6%, a difference of 0.23%), Venezuelan (2.6%, a difference of 0.25%), and Haitian (2.6%, a difference of 0.34%).
| Demographics | Rating | Rank | Hearing Disability |
| Salvadorans | 99.6 /100 | #35 | Exceptional 2.6% |
| Okinawans | 99.6 /100 | #36 | Exceptional 2.6% |
| Immigrants | Western Africa | 99.6 /100 | #37 | Exceptional 2.6% |
| Immigrants | Jamaica | 99.5 /100 | #38 | Exceptional 2.6% |
| Immigrants | China | 99.5 /100 | #39 | Exceptional 2.6% |
| Haitians | 99.5 /100 | #40 | Exceptional 2.6% |
| Immigrants | Taiwan | 99.4 /100 | #41 | Exceptional 2.6% |
| West Indians | 99.4 /100 | #42 | Exceptional 2.6% |
| Senegalese | 99.4 /100 | #43 | Exceptional 2.6% |
| Nigerians | 99.4 /100 | #44 | Exceptional 2.6% |
| Venezuelans | 99.4 /100 | #45 | Exceptional 2.6% |
| Immigrants | Dominica | 99.3 /100 | #46 | Exceptional 2.6% |
| Immigrants | Israel | 99.3 /100 | #47 | Exceptional 2.6% |
| Immigrants | Singapore | 99.3 /100 | #48 | Exceptional 2.6% |
| Immigrants | South America | 99.2 /100 | #49 | Exceptional 2.7% |
Demographics Similar to Slovaks by Hearing Disability
In terms of hearing disability, the demographic groups most similar to Slovaks are French American Indian (3.6%, a difference of 0.070%), Scandinavian (3.6%, a difference of 0.12%), Swedish (3.6%, a difference of 0.21%), Basque (3.6%, a difference of 0.26%), and Blackfeet (3.6%, a difference of 0.46%).
| Demographics | Rating | Rank | Hearing Disability |
| Fijians | 0.0 /100 | #272 | Tragic 3.5% |
| Puerto Ricans | 0.0 /100 | #273 | Tragic 3.5% |
| Swiss | 0.0 /100 | #274 | Tragic 3.5% |
| Czechoslovakians | 0.0 /100 | #275 | Tragic 3.6% |
| Danes | 0.0 /100 | #276 | Tragic 3.6% |
| Immigrants | Nonimmigrants | 0.0 /100 | #277 | Tragic 3.6% |
| Basques | 0.0 /100 | #278 | Tragic 3.6% |
| Slovaks | 0.0 /100 | #279 | Tragic 3.6% |
| French American Indians | 0.0 /100 | #280 | Tragic 3.6% |
| Scandinavians | 0.0 /100 | #281 | Tragic 3.6% |
| Swedes | 0.0 /100 | #282 | Tragic 3.6% |
| Blackfeet | 0.0 /100 | #283 | Tragic 3.6% |
| Immigrants | Micronesia | 0.0 /100 | #284 | Tragic 3.6% |
| Sioux | 0.0 /100 | #285 | Tragic 3.6% |
| Delaware | 0.0 /100 | #286 | Tragic 3.6% |