Immigrants from Uruguay vs Austrian Disability
COMPARE
Immigrants from Uruguay
Austrian
Disability
Disability Comparison
Immigrants from Uruguay
Austrians
11.3%
DISABILITY
96.4/ 100
METRIC RATING
103rd/ 347
METRIC RANK
12.0%
DISABILITY
7.2/ 100
METRIC RATING
212th/ 347
METRIC RANK
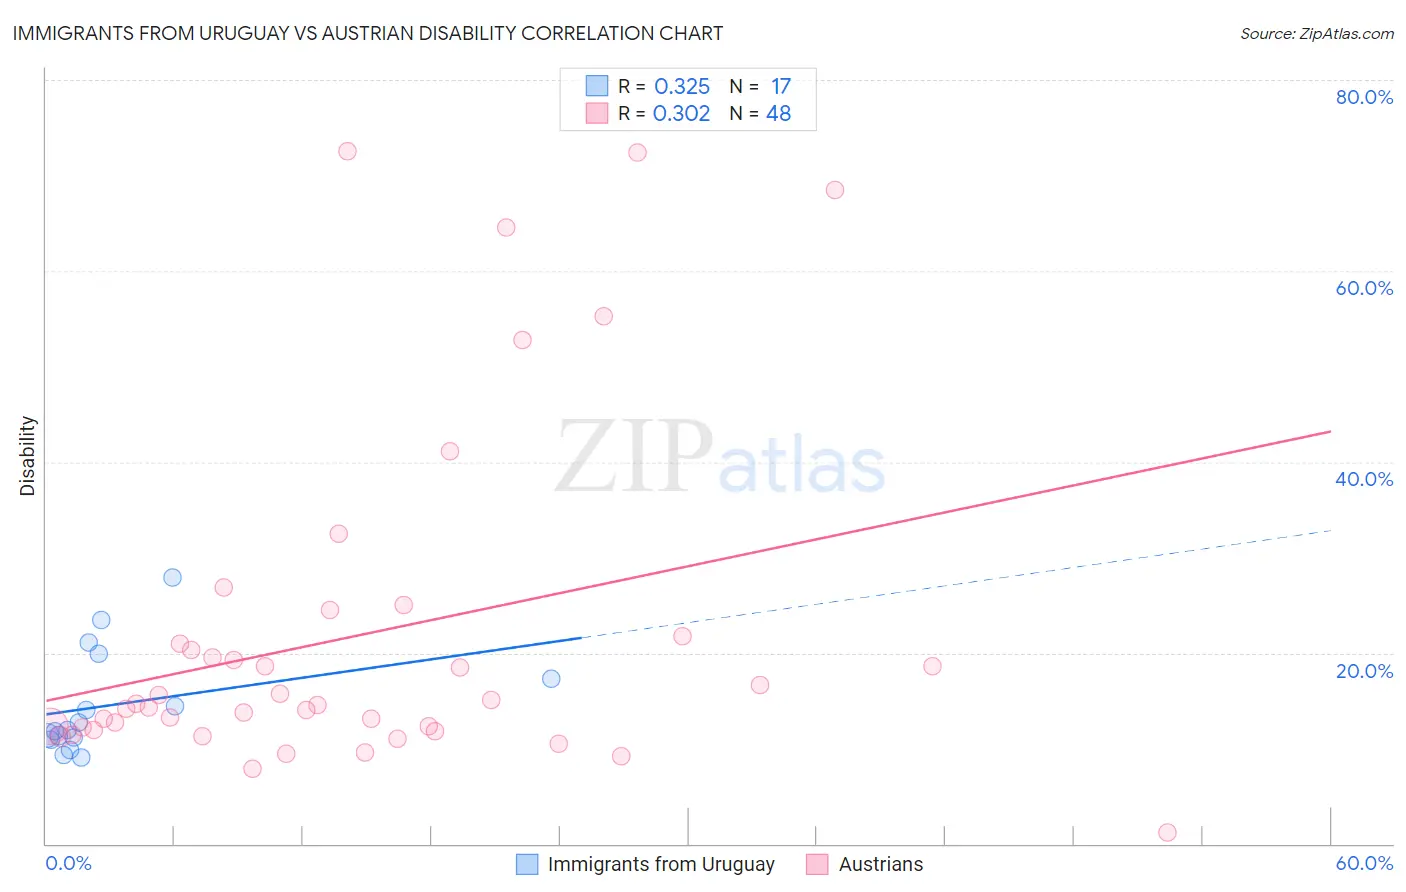
Immigrants from Uruguay vs Austrian Disability Correlation Chart
The statistical analysis conducted on geographies consisting of 133,256,548 people shows a mild positive correlation between the proportion of Immigrants from Uruguay and percentage of population with a disability in the United States with a correlation coefficient (R) of 0.325 and weighted average of 11.3%. Similarly, the statistical analysis conducted on geographies consisting of 452,057,102 people shows a mild positive correlation between the proportion of Austrians and percentage of population with a disability in the United States with a correlation coefficient (R) of 0.302 and weighted average of 12.0%, a difference of 6.7%.
Disability Correlation Summary
| Measurement | Immigrants from Uruguay | Austrian |
| Minimum | 9.0% | 1.2% |
| Maximum | 27.9% | 72.5% |
| Range | 18.8% | 71.4% |
| Mean | 14.5% | 21.8% |
| Median | 12.0% | 14.6% |
| Interquartile 25% (IQ1) | 11.0% | 12.1% |
| Interquartile 75% (IQ3) | 18.6% | 21.4% |
| Interquartile Range (IQR) | 7.6% | 9.3% |
| Standard Deviation (Sample) | 5.5% | 17.7% |
| Standard Deviation (Population) | 5.3% | 17.5% |
Similar Demographics by Disability
Demographics Similar to Immigrants from Uruguay by Disability
In terms of disability, the demographic groups most similar to Immigrants from Uruguay are Immigrants (11.3%, a difference of 0.010%), Immigrants from Kazakhstan (11.3%, a difference of 0.020%), Immigrants from Eastern Europe (11.3%, a difference of 0.040%), Nicaraguan (11.3%, a difference of 0.060%), and Immigrants from Eastern Africa (11.3%, a difference of 0.070%).
| Demographics | Rating | Rank | Disability |
| Immigrants | Zimbabwe | 97.7 /100 | #96 | Exceptional 11.2% |
| Bhutanese | 97.4 /100 | #97 | Exceptional 11.2% |
| Uruguayans | 97.4 /100 | #98 | Exceptional 11.2% |
| Immigrants | Czechoslovakia | 97.4 /100 | #99 | Exceptional 11.2% |
| Immigrants | Greece | 96.9 /100 | #100 | Exceptional 11.3% |
| Immigrants | Nicaragua | 96.8 /100 | #101 | Exceptional 11.3% |
| Immigrants | Eastern Africa | 96.7 /100 | #102 | Exceptional 11.3% |
| Immigrants | Uruguay | 96.4 /100 | #103 | Exceptional 11.3% |
| Immigrants | Immigrants | 96.4 /100 | #104 | Exceptional 11.3% |
| Immigrants | Kazakhstan | 96.4 /100 | #105 | Exceptional 11.3% |
| Immigrants | Eastern Europe | 96.3 /100 | #106 | Exceptional 11.3% |
| Nicaraguans | 96.2 /100 | #107 | Exceptional 11.3% |
| Immigrants | Nigeria | 96.0 /100 | #108 | Exceptional 11.3% |
| Immigrants | Uganda | 95.7 /100 | #109 | Exceptional 11.3% |
| Immigrants | Denmark | 95.6 /100 | #110 | Exceptional 11.3% |
Demographics Similar to Austrians by Disability
In terms of disability, the demographic groups most similar to Austrians are Immigrants from Iraq (12.0%, a difference of 0.010%), Immigrants from Cambodia (12.0%, a difference of 0.030%), Immigrants from Somalia (12.0%, a difference of 0.060%), Czech (12.0%, a difference of 0.11%), and Immigrants from Canada (12.1%, a difference of 0.18%).
| Demographics | Rating | Rank | Disability |
| Immigrants | Western Europe | 10.1 /100 | #205 | Poor 12.0% |
| Immigrants | Senegal | 9.4 /100 | #206 | Tragic 12.0% |
| Immigrants | Thailand | 9.3 /100 | #207 | Tragic 12.0% |
| Immigrants | Caribbean | 9.1 /100 | #208 | Tragic 12.0% |
| Danes | 8.7 /100 | #209 | Tragic 12.0% |
| Czechs | 7.9 /100 | #210 | Tragic 12.0% |
| Immigrants | Cambodia | 7.3 /100 | #211 | Tragic 12.0% |
| Austrians | 7.2 /100 | #212 | Tragic 12.0% |
| Immigrants | Iraq | 7.1 /100 | #213 | Tragic 12.0% |
| Immigrants | Somalia | 6.8 /100 | #214 | Tragic 12.0% |
| Immigrants | Canada | 6.1 /100 | #215 | Tragic 12.1% |
| Panamanians | 5.4 /100 | #216 | Tragic 12.1% |
| Immigrants | North America | 5.3 /100 | #217 | Tragic 12.1% |
| Immigrants | Jamaica | 5.0 /100 | #218 | Tragic 12.1% |
| Croatians | 4.9 /100 | #219 | Tragic 12.1% |