Immigrants from Brazil vs Austrian Disability
COMPARE
Immigrants from Brazil
Austrian
Disability
Disability Comparison
Immigrants from Brazil
Austrians
11.2%
DISABILITY
98.1/ 100
METRIC RATING
90th/ 347
METRIC RANK
12.0%
DISABILITY
7.2/ 100
METRIC RATING
212th/ 347
METRIC RANK
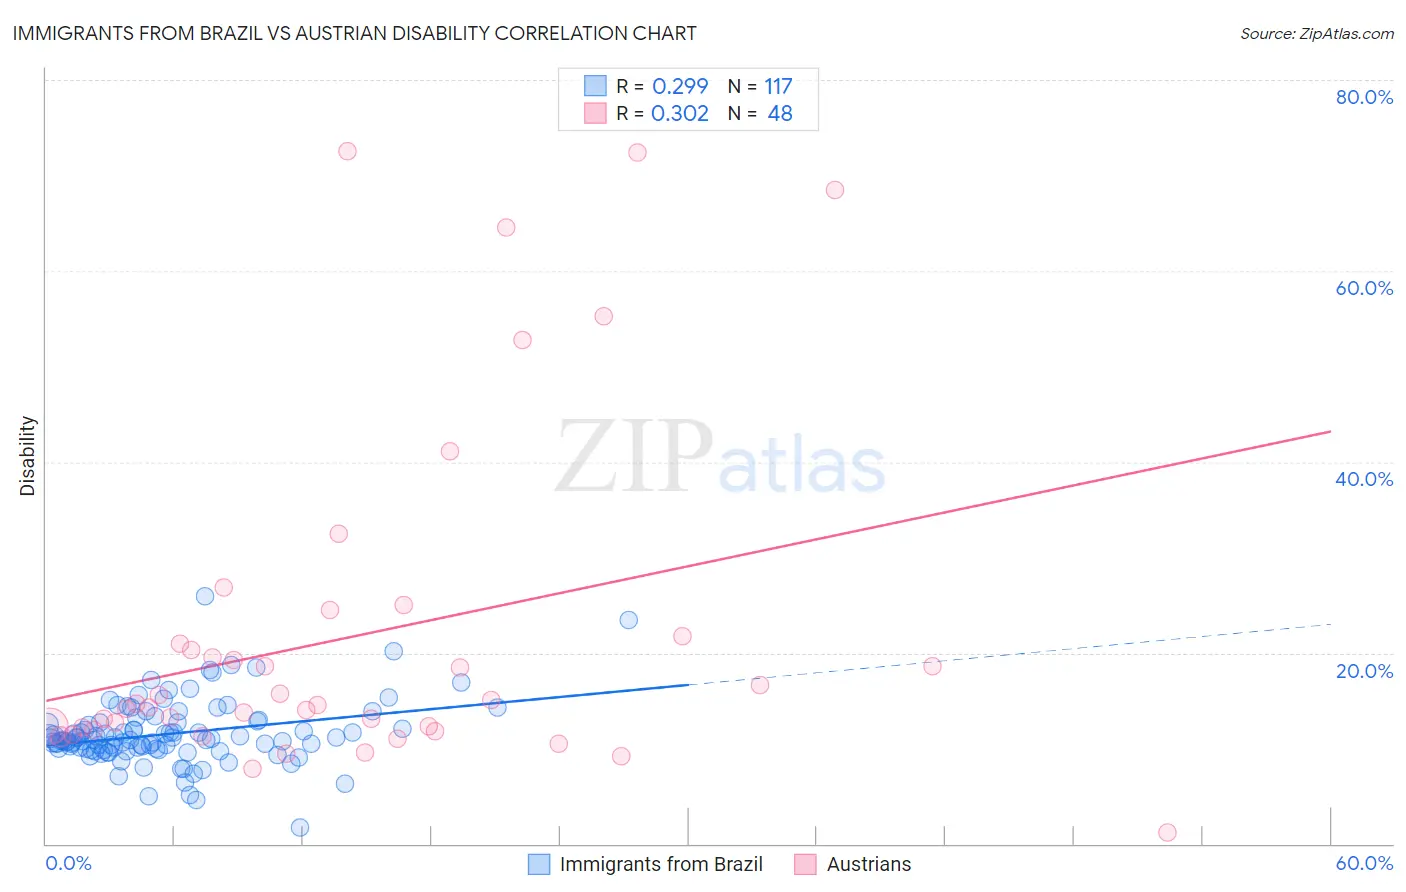
Immigrants from Brazil vs Austrian Disability Correlation Chart
The statistical analysis conducted on geographies consisting of 343,011,527 people shows a weak positive correlation between the proportion of Immigrants from Brazil and percentage of population with a disability in the United States with a correlation coefficient (R) of 0.299 and weighted average of 11.2%. Similarly, the statistical analysis conducted on geographies consisting of 452,057,102 people shows a mild positive correlation between the proportion of Austrians and percentage of population with a disability in the United States with a correlation coefficient (R) of 0.302 and weighted average of 12.0%, a difference of 7.5%.
Disability Correlation Summary
| Measurement | Immigrants from Brazil | Austrian |
| Minimum | 1.7% | 1.2% |
| Maximum | 25.9% | 72.5% |
| Range | 24.2% | 71.4% |
| Mean | 11.5% | 21.8% |
| Median | 10.9% | 14.6% |
| Interquartile 25% (IQ1) | 9.9% | 12.1% |
| Interquartile 75% (IQ3) | 12.7% | 21.4% |
| Interquartile Range (IQR) | 2.8% | 9.3% |
| Standard Deviation (Sample) | 3.4% | 17.7% |
| Standard Deviation (Population) | 3.4% | 17.5% |
Similar Demographics by Disability
Demographics Similar to Immigrants from Brazil by Disability
In terms of disability, the demographic groups most similar to Immigrants from Brazil are Immigrants from Western Asia (11.2%, a difference of 0.020%), Immigrants from South Africa (11.2%, a difference of 0.050%), Ecuadorian (11.2%, a difference of 0.060%), Immigrants from Ecuador (11.2%, a difference of 0.060%), and Immigrants from Morocco (11.2%, a difference of 0.18%).
| Demographics | Rating | Rank | Disability |
| Immigrants | Switzerland | 99.0 /100 | #83 | Exceptional 11.1% |
| Immigrants | Sierra Leone | 99.0 /100 | #84 | Exceptional 11.1% |
| Immigrants | Belarus | 98.9 /100 | #85 | Exceptional 11.1% |
| Immigrants | Russia | 98.9 /100 | #86 | Exceptional 11.1% |
| Palestinians | 98.9 /100 | #87 | Exceptional 11.1% |
| Immigrants | Romania | 98.5 /100 | #88 | Exceptional 11.2% |
| Immigrants | South Africa | 98.2 /100 | #89 | Exceptional 11.2% |
| Immigrants | Brazil | 98.1 /100 | #90 | Exceptional 11.2% |
| Immigrants | Western Asia | 98.1 /100 | #91 | Exceptional 11.2% |
| Ecuadorians | 98.0 /100 | #92 | Exceptional 11.2% |
| Immigrants | Ecuador | 98.0 /100 | #93 | Exceptional 11.2% |
| Immigrants | Morocco | 97.8 /100 | #94 | Exceptional 11.2% |
| Eastern Europeans | 97.8 /100 | #95 | Exceptional 11.2% |
| Immigrants | Zimbabwe | 97.7 /100 | #96 | Exceptional 11.2% |
| Bhutanese | 97.4 /100 | #97 | Exceptional 11.2% |
Demographics Similar to Austrians by Disability
In terms of disability, the demographic groups most similar to Austrians are Immigrants from Iraq (12.0%, a difference of 0.010%), Immigrants from Cambodia (12.0%, a difference of 0.030%), Immigrants from Somalia (12.0%, a difference of 0.060%), Czech (12.0%, a difference of 0.11%), and Immigrants from Canada (12.1%, a difference of 0.18%).
| Demographics | Rating | Rank | Disability |
| Immigrants | Western Europe | 10.1 /100 | #205 | Poor 12.0% |
| Immigrants | Senegal | 9.4 /100 | #206 | Tragic 12.0% |
| Immigrants | Thailand | 9.3 /100 | #207 | Tragic 12.0% |
| Immigrants | Caribbean | 9.1 /100 | #208 | Tragic 12.0% |
| Danes | 8.7 /100 | #209 | Tragic 12.0% |
| Czechs | 7.9 /100 | #210 | Tragic 12.0% |
| Immigrants | Cambodia | 7.3 /100 | #211 | Tragic 12.0% |
| Austrians | 7.2 /100 | #212 | Tragic 12.0% |
| Immigrants | Iraq | 7.1 /100 | #213 | Tragic 12.0% |
| Immigrants | Somalia | 6.8 /100 | #214 | Tragic 12.0% |
| Immigrants | Canada | 6.1 /100 | #215 | Tragic 12.1% |
| Panamanians | 5.4 /100 | #216 | Tragic 12.1% |
| Immigrants | North America | 5.3 /100 | #217 | Tragic 12.1% |
| Immigrants | Jamaica | 5.0 /100 | #218 | Tragic 12.1% |
| Croatians | 4.9 /100 | #219 | Tragic 12.1% |