Portuguese vs Immigrants from Nigeria Hearing Disability
COMPARE
Portuguese
Immigrants from Nigeria
Hearing Disability
Hearing Disability Comparison
Portuguese
Immigrants from Nigeria
3.5%
HEARING DISABILITY
0.1/ 100
METRIC RATING
260th/ 347
METRIC RANK
2.6%
HEARING DISABILITY
99.8/ 100
METRIC RATING
23rd/ 347
METRIC RANK
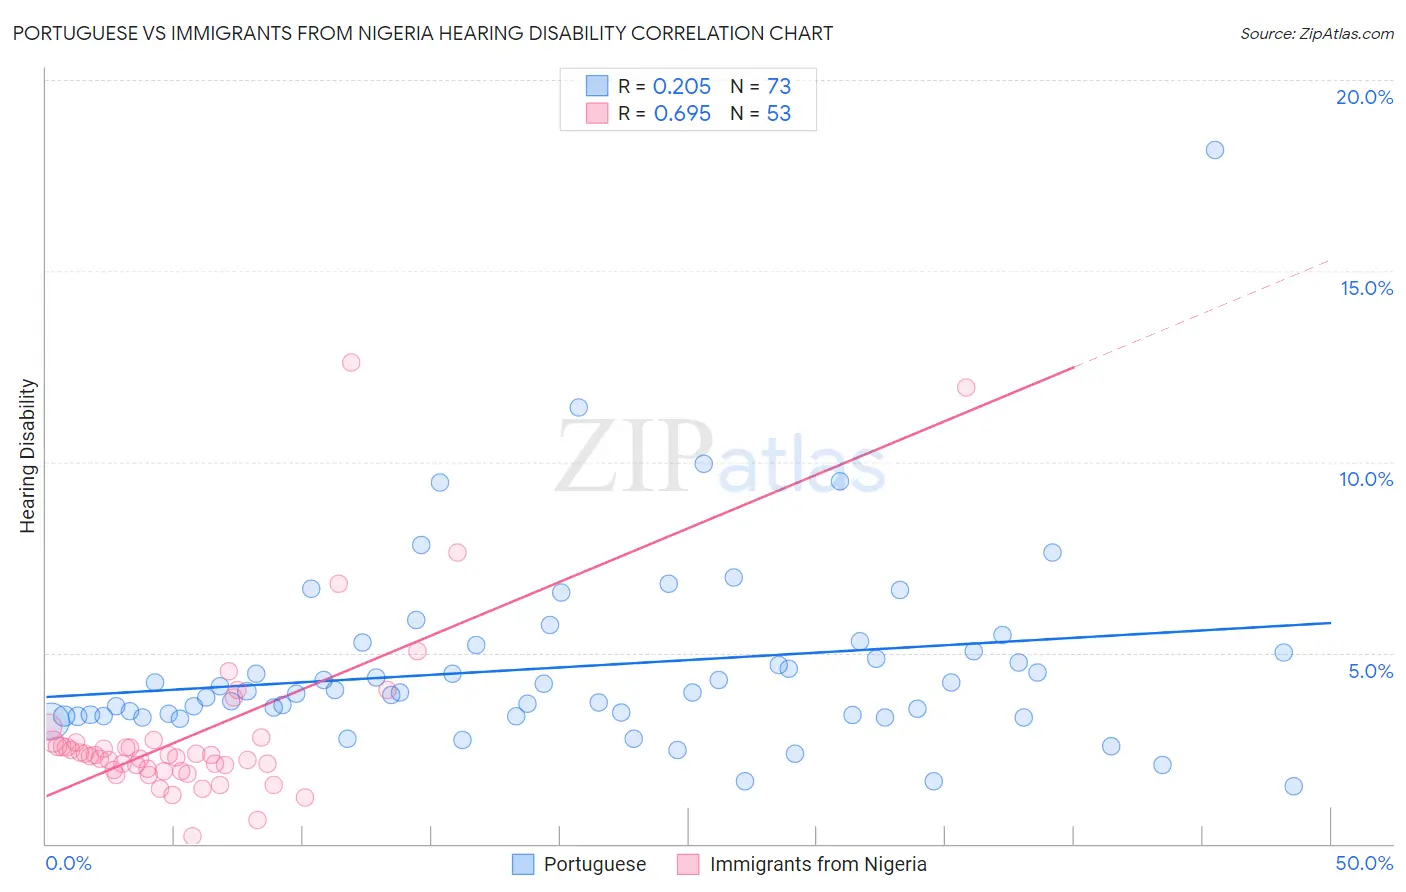
Portuguese vs Immigrants from Nigeria Hearing Disability Correlation Chart
The statistical analysis conducted on geographies consisting of 450,060,128 people shows a weak positive correlation between the proportion of Portuguese and percentage of population with hearing disability in the United States with a correlation coefficient (R) of 0.205 and weighted average of 3.5%. Similarly, the statistical analysis conducted on geographies consisting of 283,406,904 people shows a significant positive correlation between the proportion of Immigrants from Nigeria and percentage of population with hearing disability in the United States with a correlation coefficient (R) of 0.695 and weighted average of 2.6%, a difference of 34.9%.
Hearing Disability Correlation Summary
| Measurement | Portuguese | Immigrants from Nigeria |
| Minimum | 1.5% | 0.19% |
| Maximum | 18.2% | 12.6% |
| Range | 16.7% | 12.4% |
| Mean | 4.6% | 2.9% |
| Median | 3.9% | 2.3% |
| Interquartile 25% (IQ1) | 3.4% | 1.9% |
| Interquartile 75% (IQ3) | 5.1% | 2.7% |
| Interquartile Range (IQR) | 1.8% | 0.75% |
| Standard Deviation (Sample) | 2.5% | 2.3% |
| Standard Deviation (Population) | 2.5% | 2.2% |
Similar Demographics by Hearing Disability
Demographics Similar to Portuguese by Hearing Disability
In terms of hearing disability, the demographic groups most similar to Portuguese are Hawaiian (3.5%, a difference of 0.040%), Slovene (3.5%, a difference of 0.080%), Immigrants from North America (3.5%, a difference of 0.15%), Immigrants from Canada (3.5%, a difference of 0.19%), and Northern European (3.4%, a difference of 0.32%).
| Demographics | Rating | Rank | Hearing Disability |
| Carpatho Rusyns | 0.3 /100 | #253 | Tragic 3.4% |
| Slavs | 0.2 /100 | #254 | Tragic 3.4% |
| Poles | 0.2 /100 | #255 | Tragic 3.4% |
| Hmong | 0.2 /100 | #256 | Tragic 3.4% |
| Yaqui | 0.2 /100 | #257 | Tragic 3.4% |
| Northern Europeans | 0.2 /100 | #258 | Tragic 3.4% |
| Slovenes | 0.1 /100 | #259 | Tragic 3.5% |
| Portuguese | 0.1 /100 | #260 | Tragic 3.5% |
| Hawaiians | 0.1 /100 | #261 | Tragic 3.5% |
| Immigrants | North America | 0.1 /100 | #262 | Tragic 3.5% |
| Immigrants | Canada | 0.1 /100 | #263 | Tragic 3.5% |
| Immigrants | Germany | 0.1 /100 | #264 | Tragic 3.5% |
| British | 0.1 /100 | #265 | Tragic 3.5% |
| Belgians | 0.1 /100 | #266 | Tragic 3.5% |
| Canadians | 0.1 /100 | #267 | Tragic 3.5% |
Demographics Similar to Immigrants from Nigeria by Hearing Disability
In terms of hearing disability, the demographic groups most similar to Immigrants from Nigeria are Immigrants from Ghana (2.6%, a difference of 0.25%), Immigrants from Sierra Leone (2.6%, a difference of 0.50%), Ghanaian (2.5%, a difference of 0.54%), Immigrants from Bolivia (2.5%, a difference of 0.61%), and Thai (2.5%, a difference of 0.65%).
| Demographics | Rating | Rank | Hearing Disability |
| Immigrants | West Indies | 99.9 /100 | #16 | Exceptional 2.5% |
| Immigrants | India | 99.9 /100 | #17 | Exceptional 2.5% |
| Dominicans | 99.8 /100 | #18 | Exceptional 2.5% |
| Thais | 99.8 /100 | #19 | Exceptional 2.5% |
| Immigrants | Bolivia | 99.8 /100 | #20 | Exceptional 2.5% |
| Ghanaians | 99.8 /100 | #21 | Exceptional 2.5% |
| Immigrants | Sierra Leone | 99.8 /100 | #22 | Exceptional 2.6% |
| Immigrants | Nigeria | 99.8 /100 | #23 | Exceptional 2.6% |
| Immigrants | Ghana | 99.8 /100 | #24 | Exceptional 2.6% |
| Immigrants | El Salvador | 99.7 /100 | #25 | Exceptional 2.6% |
| Immigrants | Senegal | 99.7 /100 | #26 | Exceptional 2.6% |
| Immigrants | South Central Asia | 99.7 /100 | #27 | Exceptional 2.6% |
| Immigrants | Haiti | 99.7 /100 | #28 | Exceptional 2.6% |
| Bolivians | 99.7 /100 | #29 | Exceptional 2.6% |
| Immigrants | Caribbean | 99.7 /100 | #30 | Exceptional 2.6% |