Vietnamese vs Immigrants from Italy Disability Age Over 75
COMPARE
Vietnamese
Immigrants from Italy
Disability Age Over 75
Disability Age Over 75 Comparison
Vietnamese
Immigrants from Italy
47.9%
DISABILITY AGE OVER 75
11.9/ 100
METRIC RATING
210th/ 347
METRIC RANK
45.8%
DISABILITY AGE OVER 75
99.7/ 100
METRIC RATING
53rd/ 347
METRIC RANK
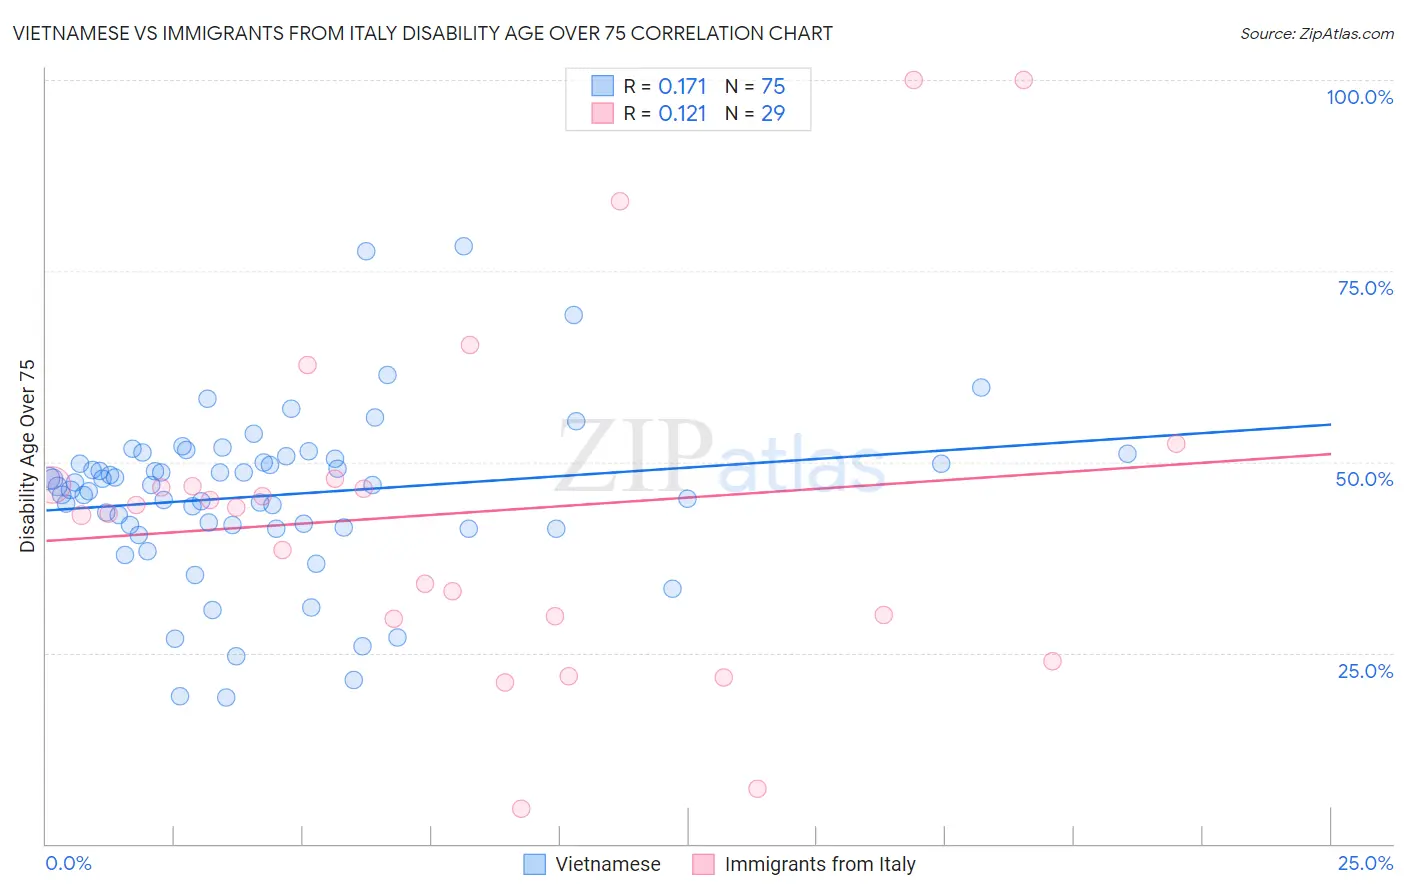
Vietnamese vs Immigrants from Italy Disability Age Over 75 Correlation Chart
The statistical analysis conducted on geographies consisting of 170,542,891 people shows a poor positive correlation between the proportion of Vietnamese and percentage of population with a disability over the age of 75 in the United States with a correlation coefficient (R) of 0.171 and weighted average of 47.9%. Similarly, the statistical analysis conducted on geographies consisting of 323,975,134 people shows a poor positive correlation between the proportion of Immigrants from Italy and percentage of population with a disability over the age of 75 in the United States with a correlation coefficient (R) of 0.121 and weighted average of 45.8%, a difference of 4.5%.
Disability Age Over 75 Correlation Summary
| Measurement | Vietnamese | Immigrants from Italy |
| Minimum | 19.1% | 4.6% |
| Maximum | 78.3% | 100.0% |
| Range | 59.2% | 95.4% |
| Mean | 45.6% | 43.4% |
| Median | 47.0% | 44.0% |
| Interquartile 25% (IQ1) | 41.4% | 29.6% |
| Interquartile 75% (IQ3) | 50.3% | 47.4% |
| Interquartile Range (IQR) | 8.9% | 17.8% |
| Standard Deviation (Sample) | 10.8% | 22.7% |
| Standard Deviation (Population) | 10.8% | 22.3% |
Similar Demographics by Disability Age Over 75
Demographics Similar to Vietnamese by Disability Age Over 75
In terms of disability age over 75, the demographic groups most similar to Vietnamese are Panamanian (47.9%, a difference of 0.010%), Immigrants from Burma/Myanmar (47.9%, a difference of 0.010%), Laotian (47.9%, a difference of 0.020%), Immigrants from Barbados (47.9%, a difference of 0.070%), and Senegalese (47.9%, a difference of 0.070%).
| Demographics | Rating | Rank | Disability Age Over 75 |
| Trinidadians and Tobagonians | 20.0 /100 | #203 | Fair 47.7% |
| Nigerians | 19.2 /100 | #204 | Poor 47.7% |
| Immigrants | Ghana | 19.1 /100 | #205 | Poor 47.7% |
| Jamaicans | 19.0 /100 | #206 | Poor 47.7% |
| Immigrants | Syria | 17.4 /100 | #207 | Poor 47.8% |
| Immigrants | Senegal | 16.9 /100 | #208 | Poor 47.8% |
| Immigrants | Indonesia | 14.2 /100 | #209 | Poor 47.8% |
| Vietnamese | 11.9 /100 | #210 | Poor 47.9% |
| Panamanians | 11.8 /100 | #211 | Poor 47.9% |
| Immigrants | Burma/Myanmar | 11.7 /100 | #212 | Poor 47.9% |
| Laotians | 11.5 /100 | #213 | Poor 47.9% |
| Immigrants | Barbados | 10.7 /100 | #214 | Poor 47.9% |
| Senegalese | 10.7 /100 | #215 | Poor 47.9% |
| Immigrants | Panama | 10.2 /100 | #216 | Poor 47.9% |
| Immigrants | Grenada | 9.4 /100 | #217 | Tragic 47.9% |
Demographics Similar to Immigrants from Italy by Disability Age Over 75
In terms of disability age over 75, the demographic groups most similar to Immigrants from Italy are Immigrants from France (45.8%, a difference of 0.020%), Immigrants from Korea (45.8%, a difference of 0.060%), Belgian (45.8%, a difference of 0.070%), Slovak (45.8%, a difference of 0.080%), and Maltese (45.8%, a difference of 0.080%).
| Demographics | Rating | Rank | Disability Age Over 75 |
| Swedes | 99.8 /100 | #46 | Exceptional 45.7% |
| Immigrants | Canada | 99.8 /100 | #47 | Exceptional 45.7% |
| Croatians | 99.8 /100 | #48 | Exceptional 45.7% |
| Immigrants | North America | 99.8 /100 | #49 | Exceptional 45.7% |
| Belgians | 99.7 /100 | #50 | Exceptional 45.8% |
| Immigrants | Korea | 99.7 /100 | #51 | Exceptional 45.8% |
| Immigrants | France | 99.7 /100 | #52 | Exceptional 45.8% |
| Immigrants | Italy | 99.7 /100 | #53 | Exceptional 45.8% |
| Slovaks | 99.6 /100 | #54 | Exceptional 45.8% |
| Maltese | 99.6 /100 | #55 | Exceptional 45.8% |
| Immigrants | Netherlands | 99.6 /100 | #56 | Exceptional 45.9% |
| Immigrants | Turkey | 99.6 /100 | #57 | Exceptional 45.9% |
| Immigrants | Israel | 99.6 /100 | #58 | Exceptional 45.9% |
| Iranians | 99.6 /100 | #59 | Exceptional 45.9% |
| Immigrants | Europe | 99.6 /100 | #60 | Exceptional 45.9% |