British vs Okinawan Cognitive Disability
COMPARE
British
Okinawan
Cognitive Disability
Cognitive Disability Comparison
British
Okinawans
17.0%
COGNITIVE DISABILITY
89.3/ 100
METRIC RATING
143rd/ 347
METRIC RANK
17.6%
COGNITIVE DISABILITY
6.8/ 100
METRIC RATING
216th/ 347
METRIC RANK
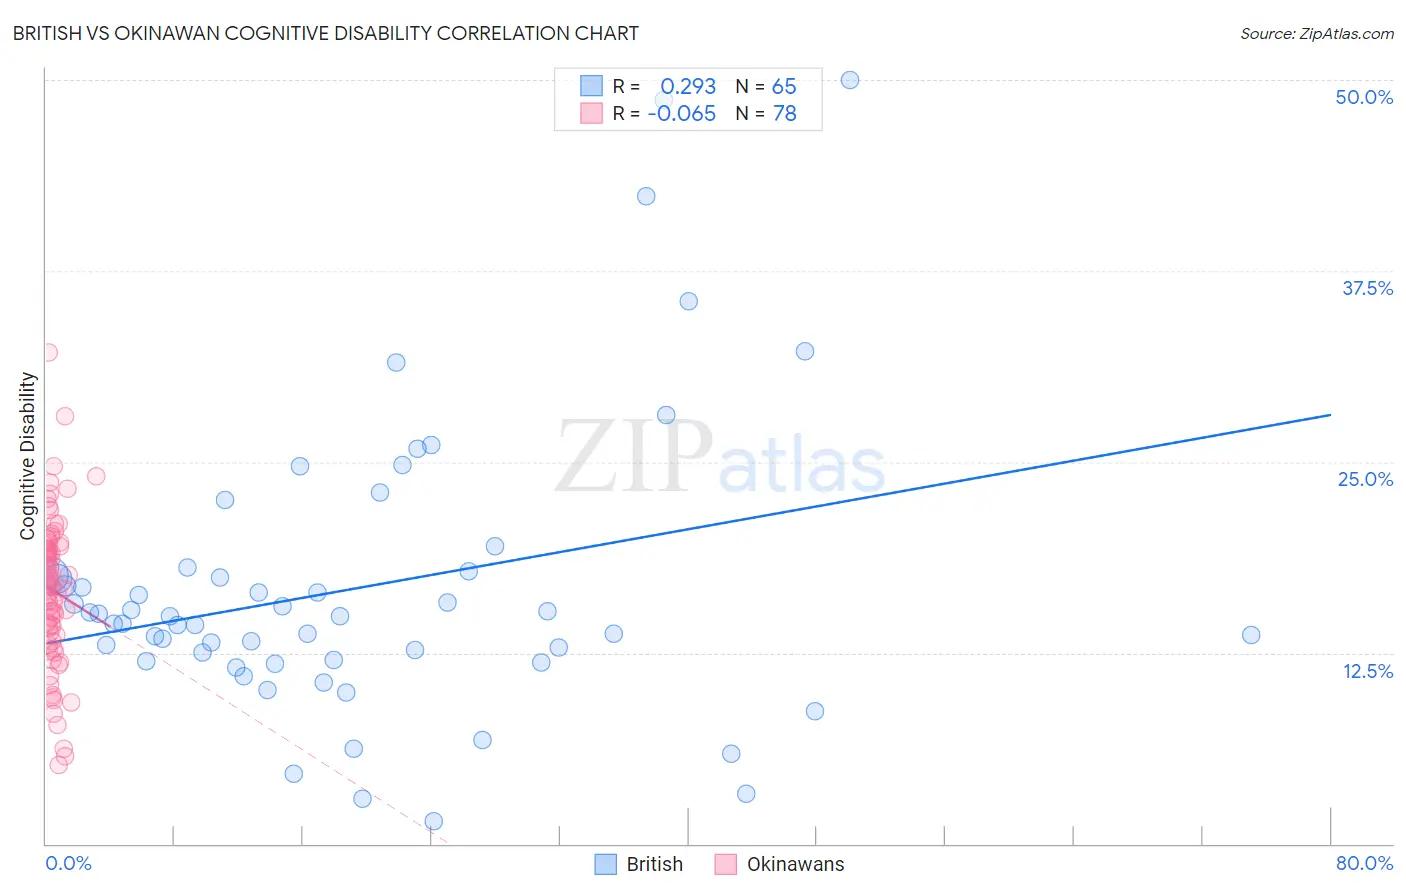
British vs Okinawan Cognitive Disability Correlation Chart
The statistical analysis conducted on geographies consisting of 531,402,976 people shows a weak positive correlation between the proportion of British and percentage of population with cognitive disability in the United States with a correlation coefficient (R) of 0.293 and weighted average of 17.0%. Similarly, the statistical analysis conducted on geographies consisting of 73,776,051 people shows a slight negative correlation between the proportion of Okinawans and percentage of population with cognitive disability in the United States with a correlation coefficient (R) of -0.065 and weighted average of 17.6%, a difference of 3.4%.
Cognitive Disability Correlation Summary
| Measurement | British | Okinawan |
| Minimum | 1.5% | 5.1% |
| Maximum | 50.0% | 32.1% |
| Range | 48.5% | 27.0% |
| Mean | 16.7% | 16.6% |
| Median | 14.9% | 16.9% |
| Interquartile 25% (IQ1) | 12.0% | 13.7% |
| Interquartile 75% (IQ3) | 17.7% | 19.5% |
| Interquartile Range (IQR) | 5.7% | 5.8% |
| Standard Deviation (Sample) | 9.5% | 4.9% |
| Standard Deviation (Population) | 9.4% | 4.9% |
Similar Demographics by Cognitive Disability
Demographics Similar to British by Cognitive Disability
In terms of cognitive disability, the demographic groups most similar to British are Immigrants from Brazil (17.0%, a difference of 0.0%), Carpatho Rusyn (17.0%, a difference of 0.020%), French (17.0%, a difference of 0.050%), Chilean (17.0%, a difference of 0.050%), and Aleut (17.0%, a difference of 0.050%).
| Demographics | Rating | Rank | Cognitive Disability |
| Israelis | 91.0 /100 | #136 | Exceptional 17.0% |
| Immigrants | Norway | 90.9 /100 | #137 | Exceptional 17.0% |
| Welsh | 90.8 /100 | #138 | Exceptional 17.0% |
| French | 90.0 /100 | #139 | Excellent 17.0% |
| Chileans | 89.9 /100 | #140 | Excellent 17.0% |
| Aleuts | 89.9 /100 | #141 | Excellent 17.0% |
| Carpatho Rusyns | 89.6 /100 | #142 | Excellent 17.0% |
| British | 89.3 /100 | #143 | Excellent 17.0% |
| Immigrants | Brazil | 89.3 /100 | #144 | Excellent 17.0% |
| Immigrants | South Eastern Asia | 88.7 /100 | #145 | Excellent 17.0% |
| Costa Ricans | 88.0 /100 | #146 | Excellent 17.0% |
| Scotch-Irish | 85.9 /100 | #147 | Excellent 17.1% |
| French Canadians | 85.7 /100 | #148 | Excellent 17.1% |
| Cypriots | 85.7 /100 | #149 | Excellent 17.1% |
| Basques | 85.5 /100 | #150 | Excellent 17.1% |
Demographics Similar to Okinawans by Cognitive Disability
In terms of cognitive disability, the demographic groups most similar to Okinawans are Alaskan Athabascan (17.6%, a difference of 0.010%), Immigrants from El Salvador (17.6%, a difference of 0.020%), Salvadoran (17.6%, a difference of 0.020%), Hawaiian (17.6%, a difference of 0.040%), and Immigrants from Oceania (17.6%, a difference of 0.050%).
| Demographics | Rating | Rank | Cognitive Disability |
| Immigrants | Trinidad and Tobago | 8.7 /100 | #209 | Tragic 17.6% |
| Immigrants | Jamaica | 8.5 /100 | #210 | Tragic 17.6% |
| Taiwanese | 7.7 /100 | #211 | Tragic 17.6% |
| Immigrants | Oceania | 7.3 /100 | #212 | Tragic 17.6% |
| Hawaiians | 7.2 /100 | #213 | Tragic 17.6% |
| Immigrants | El Salvador | 7.0 /100 | #214 | Tragic 17.6% |
| Alaskan Athabascans | 6.9 /100 | #215 | Tragic 17.6% |
| Okinawans | 6.8 /100 | #216 | Tragic 17.6% |
| Salvadorans | 6.7 /100 | #217 | Tragic 17.6% |
| Icelanders | 6.4 /100 | #218 | Tragic 17.6% |
| Immigrants | Sierra Leone | 6.3 /100 | #219 | Tragic 17.6% |
| Zimbabweans | 6.1 /100 | #220 | Tragic 17.6% |
| Moroccans | 5.9 /100 | #221 | Tragic 17.6% |
| Central Americans | 4.5 /100 | #222 | Tragic 17.7% |
| Alsatians | 4.5 /100 | #223 | Tragic 17.7% |