Immigrants from Iraq vs German Cognitive Disability
COMPARE
Immigrants from Iraq
German
Cognitive Disability
Cognitive Disability Comparison
Immigrants from Iraq
Germans
17.8%
COGNITIVE DISABILITY
1.8/ 100
METRIC RATING
236th/ 347
METRIC RANK
16.7%
COGNITIVE DISABILITY
99.3/ 100
METRIC RATING
72nd/ 347
METRIC RANK
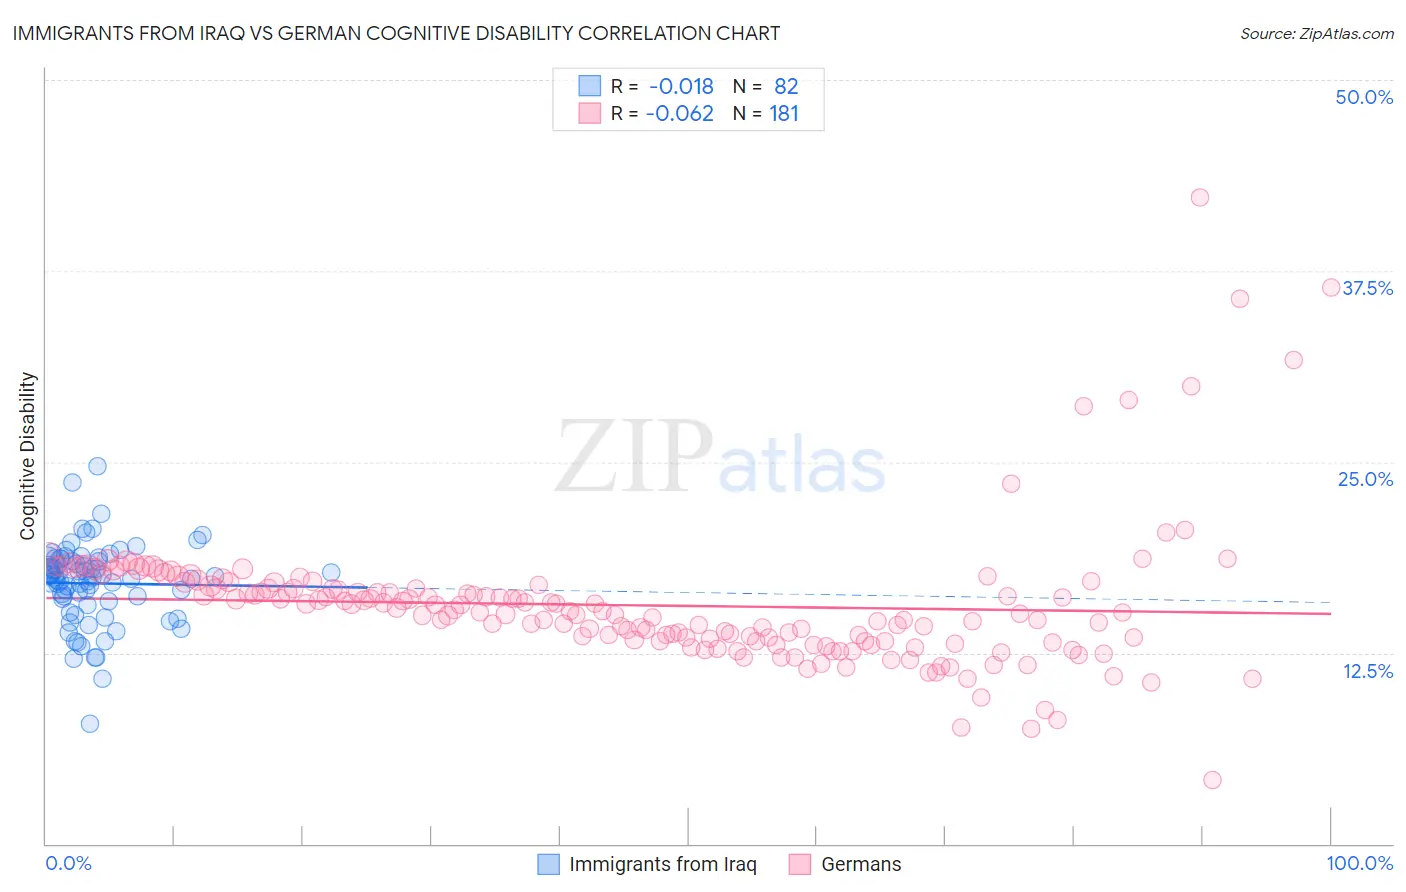
Immigrants from Iraq vs German Cognitive Disability Correlation Chart
The statistical analysis conducted on geographies consisting of 194,729,131 people shows no correlation between the proportion of Immigrants from Iraq and percentage of population with cognitive disability in the United States with a correlation coefficient (R) of -0.018 and weighted average of 17.8%. Similarly, the statistical analysis conducted on geographies consisting of 580,999,229 people shows a slight negative correlation between the proportion of Germans and percentage of population with cognitive disability in the United States with a correlation coefficient (R) of -0.062 and weighted average of 16.7%, a difference of 6.6%.
Cognitive Disability Correlation Summary
| Measurement | Immigrants from Iraq | German |
| Minimum | 7.9% | 4.2% |
| Maximum | 24.7% | 42.3% |
| Range | 16.8% | 38.1% |
| Mean | 17.0% | 15.6% |
| Median | 17.4% | 15.2% |
| Interquartile 25% (IQ1) | 15.9% | 13.3% |
| Interquartile 75% (IQ3) | 18.5% | 16.9% |
| Interquartile Range (IQR) | 2.6% | 3.7% |
| Standard Deviation (Sample) | 2.7% | 4.5% |
| Standard Deviation (Population) | 2.6% | 4.5% |
Similar Demographics by Cognitive Disability
Demographics Similar to Immigrants from Iraq by Cognitive Disability
In terms of cognitive disability, the demographic groups most similar to Immigrants from Iraq are Immigrants from Mexico (17.8%, a difference of 0.010%), Cheyenne (17.8%, a difference of 0.040%), Osage (17.8%, a difference of 0.060%), Spanish American Indian (17.8%, a difference of 0.060%), and Tongan (17.8%, a difference of 0.080%).
| Demographics | Rating | Rank | Cognitive Disability |
| Immigrants | Guatemala | 2.2 /100 | #229 | Tragic 17.7% |
| Mongolians | 2.2 /100 | #230 | Tragic 17.7% |
| Guatemalans | 2.1 /100 | #231 | Tragic 17.8% |
| Tongans | 2.1 /100 | #232 | Tragic 17.8% |
| Panamanians | 2.1 /100 | #233 | Tragic 17.8% |
| Osage | 2.0 /100 | #234 | Tragic 17.8% |
| Spanish American Indians | 2.0 /100 | #235 | Tragic 17.8% |
| Immigrants | Iraq | 1.8 /100 | #236 | Tragic 17.8% |
| Immigrants | Mexico | 1.8 /100 | #237 | Tragic 17.8% |
| Cheyenne | 1.7 /100 | #238 | Tragic 17.8% |
| Cajuns | 1.4 /100 | #239 | Tragic 17.8% |
| Iraqis | 1.4 /100 | #240 | Tragic 17.8% |
| Mexicans | 1.1 /100 | #241 | Tragic 17.8% |
| Paiute | 1.1 /100 | #242 | Tragic 17.8% |
| Immigrants | Bangladesh | 1.0 /100 | #243 | Tragic 17.8% |
Demographics Similar to Germans by Cognitive Disability
In terms of cognitive disability, the demographic groups most similar to Germans are Burmese (16.7%, a difference of 0.010%), Slavic (16.7%, a difference of 0.010%), Immigrants from Sweden (16.7%, a difference of 0.020%), Immigrants from Belgium (16.7%, a difference of 0.020%), and Estonian (16.7%, a difference of 0.020%).
| Demographics | Rating | Rank | Cognitive Disability |
| Colombians | 99.6 /100 | #65 | Exceptional 16.6% |
| Immigrants | Ukraine | 99.5 /100 | #66 | Exceptional 16.6% |
| Latvians | 99.5 /100 | #67 | Exceptional 16.6% |
| Ukrainians | 99.4 /100 | #68 | Exceptional 16.6% |
| Immigrants | Uzbekistan | 99.4 /100 | #69 | Exceptional 16.7% |
| Immigrants | Sweden | 99.4 /100 | #70 | Exceptional 16.7% |
| Immigrants | Belgium | 99.3 /100 | #71 | Exceptional 16.7% |
| Germans | 99.3 /100 | #72 | Exceptional 16.7% |
| Burmese | 99.3 /100 | #73 | Exceptional 16.7% |
| Slavs | 99.3 /100 | #74 | Exceptional 16.7% |
| Estonians | 99.3 /100 | #75 | Exceptional 16.7% |
| Immigrants | Serbia | 99.3 /100 | #76 | Exceptional 16.7% |
| Immigrants | Hungary | 99.3 /100 | #77 | Exceptional 16.7% |
| Peruvians | 99.3 /100 | #78 | Exceptional 16.7% |
| Immigrants | Bulgaria | 99.3 /100 | #79 | Exceptional 16.7% |