Immigrants from Turkey vs German Cognitive Disability
COMPARE
Immigrants from Turkey
German
Cognitive Disability
Cognitive Disability Comparison
Immigrants from Turkey
Germans
17.2%
COGNITIVE DISABILITY
56.7/ 100
METRIC RATING
172nd/ 347
METRIC RANK
16.7%
COGNITIVE DISABILITY
99.3/ 100
METRIC RATING
72nd/ 347
METRIC RANK
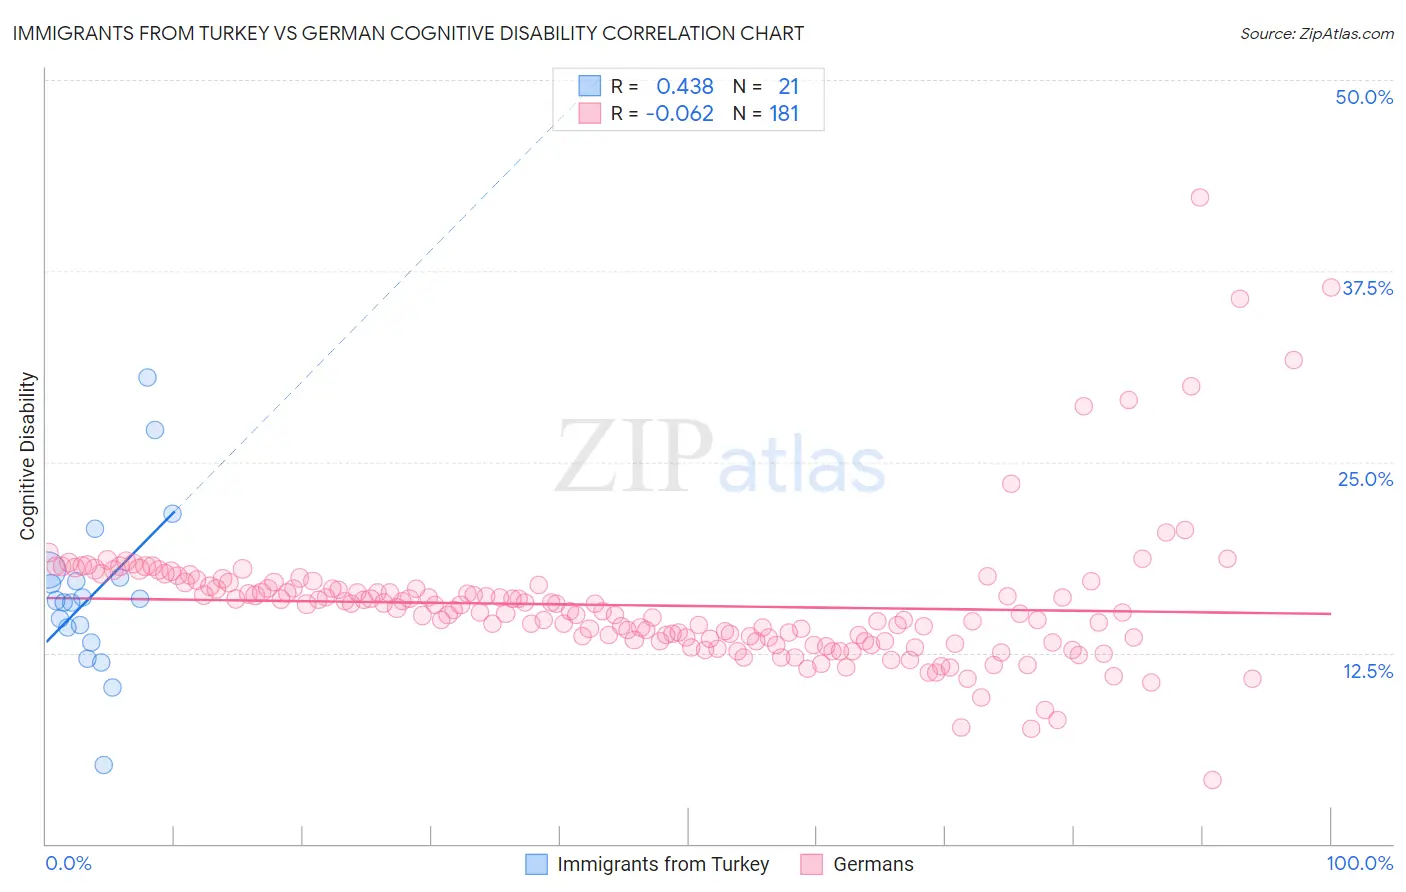
Immigrants from Turkey vs German Cognitive Disability Correlation Chart
The statistical analysis conducted on geographies consisting of 223,051,603 people shows a moderate positive correlation between the proportion of Immigrants from Turkey and percentage of population with cognitive disability in the United States with a correlation coefficient (R) of 0.438 and weighted average of 17.2%. Similarly, the statistical analysis conducted on geographies consisting of 580,999,229 people shows a slight negative correlation between the proportion of Germans and percentage of population with cognitive disability in the United States with a correlation coefficient (R) of -0.062 and weighted average of 16.7%, a difference of 3.5%.
Cognitive Disability Correlation Summary
| Measurement | Immigrants from Turkey | German |
| Minimum | 5.2% | 4.2% |
| Maximum | 30.5% | 42.3% |
| Range | 25.3% | 38.1% |
| Mean | 16.4% | 15.6% |
| Median | 15.9% | 15.2% |
| Interquartile 25% (IQ1) | 13.7% | 13.3% |
| Interquartile 75% (IQ3) | 17.7% | 16.9% |
| Interquartile Range (IQR) | 4.0% | 3.7% |
| Standard Deviation (Sample) | 5.4% | 4.5% |
| Standard Deviation (Population) | 5.3% | 4.5% |
Similar Demographics by Cognitive Disability
Demographics Similar to Immigrants from Turkey by Cognitive Disability
In terms of cognitive disability, the demographic groups most similar to Immigrants from Turkey are Tlingit-Haida (17.2%, a difference of 0.080%), Ecuadorian (17.2%, a difference of 0.090%), Immigrants from Portugal (17.2%, a difference of 0.15%), Immigrants (17.2%, a difference of 0.17%), and Immigrants from Northern Africa (17.3%, a difference of 0.18%).
| Demographics | Rating | Rank | Cognitive Disability |
| Immigrants | Albania | 64.9 /100 | #165 | Good 17.2% |
| Immigrants | Ecuador | 64.4 /100 | #166 | Good 17.2% |
| Immigrants | Syria | 63.5 /100 | #167 | Good 17.2% |
| Immigrants | Immigrants | 62.5 /100 | #168 | Good 17.2% |
| Immigrants | Portugal | 61.8 /100 | #169 | Good 17.2% |
| Ecuadorians | 59.6 /100 | #170 | Average 17.2% |
| Tlingit-Haida | 59.4 /100 | #171 | Average 17.2% |
| Immigrants | Turkey | 56.7 /100 | #172 | Average 17.2% |
| Immigrants | Northern Africa | 50.2 /100 | #173 | Average 17.3% |
| Laotians | 50.0 /100 | #174 | Average 17.3% |
| Tsimshian | 49.8 /100 | #175 | Average 17.3% |
| Shoshone | 49.2 /100 | #176 | Average 17.3% |
| Ute | 49.1 /100 | #177 | Average 17.3% |
| Spanish | 48.9 /100 | #178 | Average 17.3% |
| Sioux | 48.6 /100 | #179 | Average 17.3% |
Demographics Similar to Germans by Cognitive Disability
In terms of cognitive disability, the demographic groups most similar to Germans are Burmese (16.7%, a difference of 0.010%), Slavic (16.7%, a difference of 0.010%), Immigrants from Sweden (16.7%, a difference of 0.020%), Immigrants from Belgium (16.7%, a difference of 0.020%), and Estonian (16.7%, a difference of 0.020%).
| Demographics | Rating | Rank | Cognitive Disability |
| Colombians | 99.6 /100 | #65 | Exceptional 16.6% |
| Immigrants | Ukraine | 99.5 /100 | #66 | Exceptional 16.6% |
| Latvians | 99.5 /100 | #67 | Exceptional 16.6% |
| Ukrainians | 99.4 /100 | #68 | Exceptional 16.6% |
| Immigrants | Uzbekistan | 99.4 /100 | #69 | Exceptional 16.7% |
| Immigrants | Sweden | 99.4 /100 | #70 | Exceptional 16.7% |
| Immigrants | Belgium | 99.3 /100 | #71 | Exceptional 16.7% |
| Germans | 99.3 /100 | #72 | Exceptional 16.7% |
| Burmese | 99.3 /100 | #73 | Exceptional 16.7% |
| Slavs | 99.3 /100 | #74 | Exceptional 16.7% |
| Estonians | 99.3 /100 | #75 | Exceptional 16.7% |
| Immigrants | Serbia | 99.3 /100 | #76 | Exceptional 16.7% |
| Immigrants | Hungary | 99.3 /100 | #77 | Exceptional 16.7% |
| Peruvians | 99.3 /100 | #78 | Exceptional 16.7% |
| Immigrants | Bulgaria | 99.3 /100 | #79 | Exceptional 16.7% |