Ukrainian vs Immigrants from Caribbean Ambulatory Disability
COMPARE
Ukrainian
Immigrants from Caribbean
Ambulatory Disability
Ambulatory Disability Comparison
Ukrainians
Immigrants from Caribbean
6.2%
AMBULATORY DISABILITY
34.0/ 100
METRIC RATING
189th/ 347
METRIC RANK
6.7%
AMBULATORY DISABILITY
0.0/ 100
METRIC RATING
279th/ 347
METRIC RANK
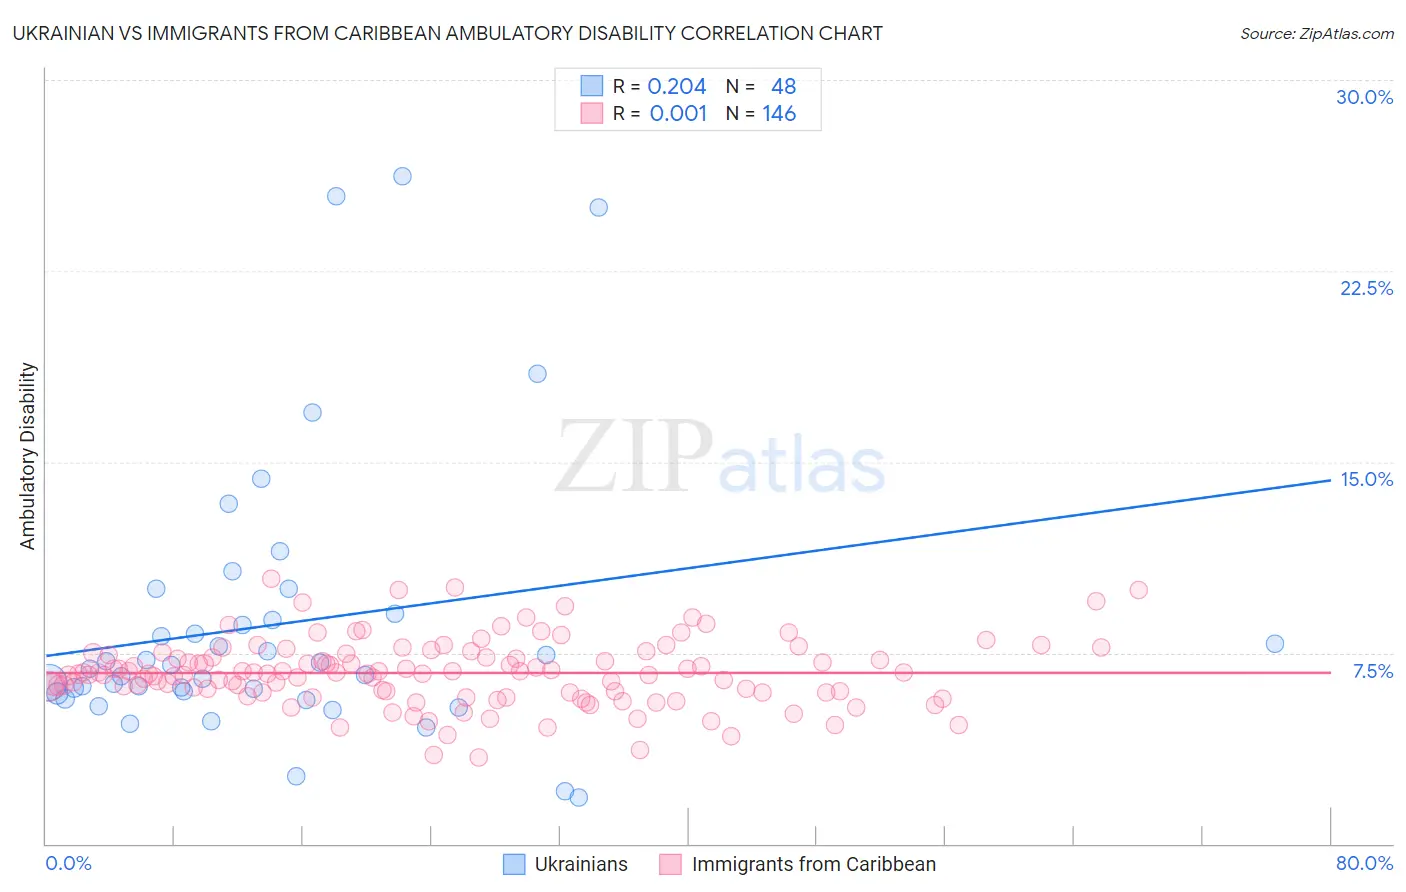
Ukrainian vs Immigrants from Caribbean Ambulatory Disability Correlation Chart
The statistical analysis conducted on geographies consisting of 448,487,424 people shows a weak positive correlation between the proportion of Ukrainians and percentage of population with ambulatory disability in the United States with a correlation coefficient (R) of 0.204 and weighted average of 6.2%. Similarly, the statistical analysis conducted on geographies consisting of 449,814,526 people shows no correlation between the proportion of Immigrants from Caribbean and percentage of population with ambulatory disability in the United States with a correlation coefficient (R) of 0.001 and weighted average of 6.7%, a difference of 9.3%.
Ambulatory Disability Correlation Summary
| Measurement | Ukrainian | Immigrants from Caribbean |
| Minimum | 1.8% | 3.4% |
| Maximum | 26.2% | 10.4% |
| Range | 24.4% | 7.0% |
| Mean | 8.6% | 6.7% |
| Median | 6.9% | 6.7% |
| Interquartile 25% (IQ1) | 5.9% | 6.0% |
| Interquartile 75% (IQ3) | 8.9% | 7.4% |
| Interquartile Range (IQR) | 3.0% | 1.4% |
| Standard Deviation (Sample) | 5.5% | 1.3% |
| Standard Deviation (Population) | 5.4% | 1.3% |
Similar Demographics by Ambulatory Disability
Demographics Similar to Ukrainians by Ambulatory Disability
In terms of ambulatory disability, the demographic groups most similar to Ukrainians are British (6.2%, a difference of 0.020%), Immigrants from Western Africa (6.2%, a difference of 0.040%), Carpatho Rusyn (6.2%, a difference of 0.080%), Immigrants from Guatemala (6.2%, a difference of 0.12%), and European (6.2%, a difference of 0.13%).
| Demographics | Rating | Rank | Ambulatory Disability |
| Serbians | 42.8 /100 | #182 | Average 6.1% |
| Immigrants | Thailand | 42.2 /100 | #183 | Average 6.1% |
| Immigrants | Ghana | 41.2 /100 | #184 | Average 6.1% |
| Immigrants | Bosnia and Herzegovina | 37.2 /100 | #185 | Fair 6.2% |
| Europeans | 36.2 /100 | #186 | Fair 6.2% |
| Carpatho Rusyns | 35.3 /100 | #187 | Fair 6.2% |
| British | 34.3 /100 | #188 | Fair 6.2% |
| Ukrainians | 34.0 /100 | #189 | Fair 6.2% |
| Immigrants | Western Africa | 33.4 /100 | #190 | Fair 6.2% |
| Immigrants | Guatemala | 31.9 /100 | #191 | Fair 6.2% |
| Immigrants | Western Europe | 31.6 /100 | #192 | Fair 6.2% |
| Guatemalans | 30.0 /100 | #193 | Fair 6.2% |
| Alaska Natives | 29.8 /100 | #194 | Fair 6.2% |
| Belgians | 28.6 /100 | #195 | Fair 6.2% |
| Malaysians | 28.2 /100 | #196 | Fair 6.2% |
Demographics Similar to Immigrants from Caribbean by Ambulatory Disability
In terms of ambulatory disability, the demographic groups most similar to Immigrants from Caribbean are Pennsylvania German (6.8%, a difference of 0.10%), Yaqui (6.8%, a difference of 0.17%), Barbadian (6.8%, a difference of 0.30%), Immigrants from West Indies (6.7%, a difference of 0.31%), and Jamaican (6.7%, a difference of 0.39%).
| Demographics | Rating | Rank | Ambulatory Disability |
| French Canadians | 0.1 /100 | #272 | Tragic 6.7% |
| Whites/Caucasians | 0.1 /100 | #273 | Tragic 6.7% |
| Sioux | 0.1 /100 | #274 | Tragic 6.7% |
| Immigrants | Guyana | 0.1 /100 | #275 | Tragic 6.7% |
| Celtics | 0.1 /100 | #276 | Tragic 6.7% |
| Jamaicans | 0.1 /100 | #277 | Tragic 6.7% |
| Immigrants | West Indies | 0.1 /100 | #278 | Tragic 6.7% |
| Immigrants | Caribbean | 0.0 /100 | #279 | Tragic 6.7% |
| Pennsylvania Germans | 0.0 /100 | #280 | Tragic 6.8% |
| Yaqui | 0.0 /100 | #281 | Tragic 6.8% |
| Barbadians | 0.0 /100 | #282 | Tragic 6.8% |
| Immigrants | Barbados | 0.0 /100 | #283 | Tragic 6.8% |
| Immigrants | Jamaica | 0.0 /100 | #284 | Tragic 6.8% |
| Fijians | 0.0 /100 | #285 | Tragic 6.8% |
| Yakama | 0.0 /100 | #286 | Tragic 6.8% |