Ukrainian vs Immigrants from Brazil Cognitive Disability
COMPARE
Ukrainian
Immigrants from Brazil
Cognitive Disability
Cognitive Disability Comparison
Ukrainians
Immigrants from Brazil
16.6%
COGNITIVE DISABILITY
99.4/ 100
METRIC RATING
68th/ 347
METRIC RANK
17.0%
COGNITIVE DISABILITY
89.3/ 100
METRIC RATING
144th/ 347
METRIC RANK
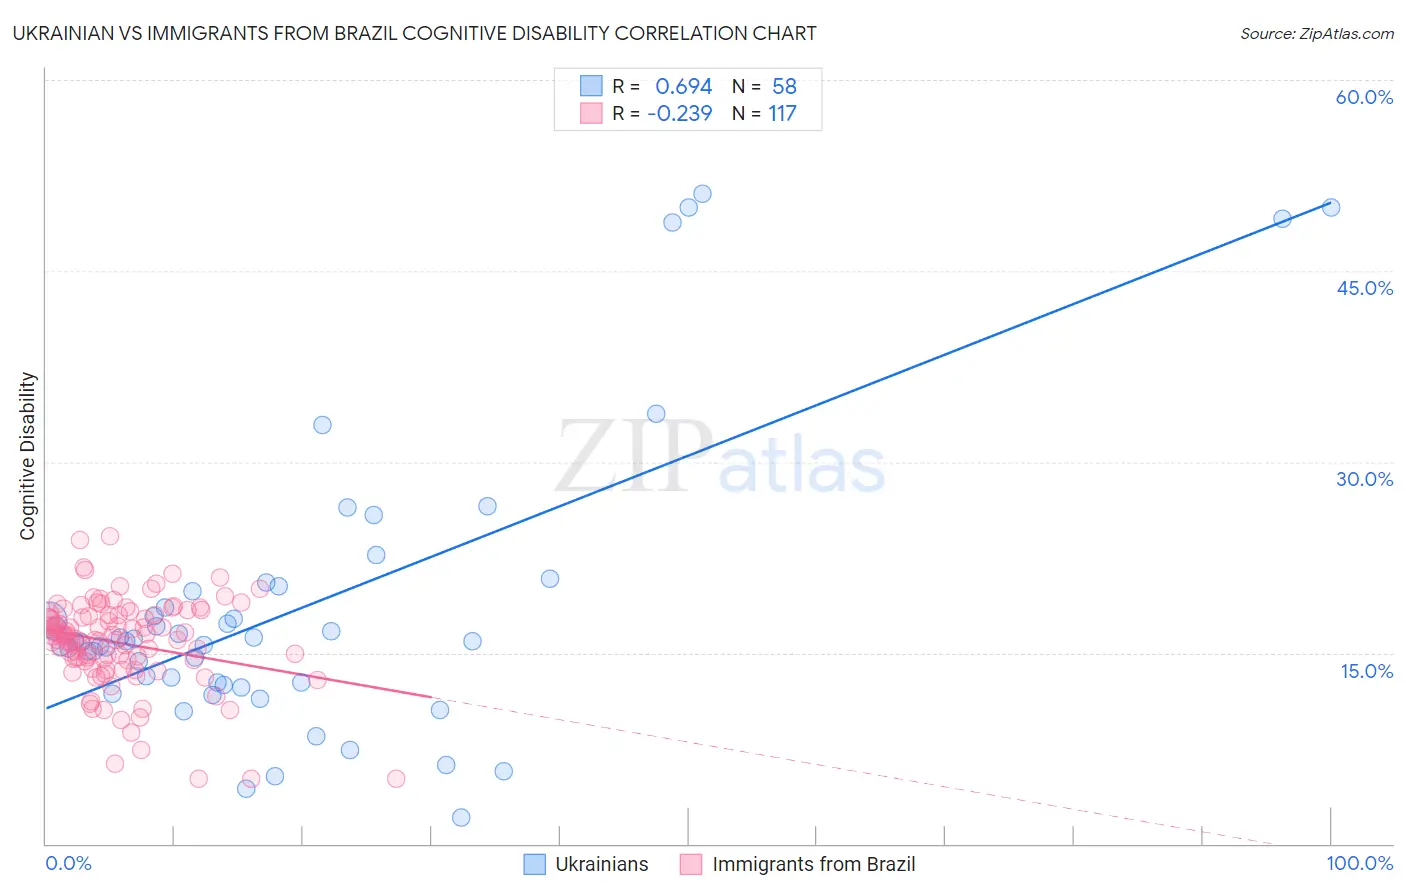
Ukrainian vs Immigrants from Brazil Cognitive Disability Correlation Chart
The statistical analysis conducted on geographies consisting of 448,632,729 people shows a significant positive correlation between the proportion of Ukrainians and percentage of population with cognitive disability in the United States with a correlation coefficient (R) of 0.694 and weighted average of 16.6%. Similarly, the statistical analysis conducted on geographies consisting of 343,010,044 people shows a weak negative correlation between the proportion of Immigrants from Brazil and percentage of population with cognitive disability in the United States with a correlation coefficient (R) of -0.239 and weighted average of 17.0%, a difference of 2.2%.
Cognitive Disability Correlation Summary
| Measurement | Ukrainian | Immigrants from Brazil |
| Minimum | 2.1% | 5.1% |
| Maximum | 51.1% | 24.2% |
| Range | 49.0% | 19.1% |
| Mean | 18.5% | 15.8% |
| Median | 15.9% | 16.3% |
| Interquartile 25% (IQ1) | 12.6% | 14.4% |
| Interquartile 75% (IQ3) | 19.9% | 18.0% |
| Interquartile Range (IQR) | 7.2% | 3.6% |
| Standard Deviation (Sample) | 11.4% | 3.5% |
| Standard Deviation (Population) | 11.3% | 3.5% |
Similar Demographics by Cognitive Disability
Demographics Similar to Ukrainians by Cognitive Disability
In terms of cognitive disability, the demographic groups most similar to Ukrainians are Latvian (16.6%, a difference of 0.040%), Immigrants from Ukraine (16.6%, a difference of 0.080%), Immigrants from Uzbekistan (16.7%, a difference of 0.080%), Immigrants from Sweden (16.7%, a difference of 0.090%), and Immigrants from Belgium (16.7%, a difference of 0.10%).
| Demographics | Rating | Rank | Cognitive Disability |
| Immigrants | England | 99.6 /100 | #61 | Exceptional 16.6% |
| Czechoslovakians | 99.6 /100 | #62 | Exceptional 16.6% |
| Argentineans | 99.6 /100 | #63 | Exceptional 16.6% |
| Venezuelans | 99.6 /100 | #64 | Exceptional 16.6% |
| Colombians | 99.6 /100 | #65 | Exceptional 16.6% |
| Immigrants | Ukraine | 99.5 /100 | #66 | Exceptional 16.6% |
| Latvians | 99.5 /100 | #67 | Exceptional 16.6% |
| Ukrainians | 99.4 /100 | #68 | Exceptional 16.6% |
| Immigrants | Uzbekistan | 99.4 /100 | #69 | Exceptional 16.7% |
| Immigrants | Sweden | 99.4 /100 | #70 | Exceptional 16.7% |
| Immigrants | Belgium | 99.3 /100 | #71 | Exceptional 16.7% |
| Germans | 99.3 /100 | #72 | Exceptional 16.7% |
| Burmese | 99.3 /100 | #73 | Exceptional 16.7% |
| Slavs | 99.3 /100 | #74 | Exceptional 16.7% |
| Estonians | 99.3 /100 | #75 | Exceptional 16.7% |
Demographics Similar to Immigrants from Brazil by Cognitive Disability
In terms of cognitive disability, the demographic groups most similar to Immigrants from Brazil are British (17.0%, a difference of 0.0%), Carpatho Rusyn (17.0%, a difference of 0.020%), French (17.0%, a difference of 0.050%), Chilean (17.0%, a difference of 0.050%), and Aleut (17.0%, a difference of 0.050%).
| Demographics | Rating | Rank | Cognitive Disability |
| Immigrants | Norway | 90.9 /100 | #137 | Exceptional 17.0% |
| Welsh | 90.8 /100 | #138 | Exceptional 17.0% |
| French | 90.0 /100 | #139 | Excellent 17.0% |
| Chileans | 89.9 /100 | #140 | Excellent 17.0% |
| Aleuts | 89.9 /100 | #141 | Excellent 17.0% |
| Carpatho Rusyns | 89.6 /100 | #142 | Excellent 17.0% |
| British | 89.3 /100 | #143 | Excellent 17.0% |
| Immigrants | Brazil | 89.3 /100 | #144 | Excellent 17.0% |
| Immigrants | South Eastern Asia | 88.7 /100 | #145 | Excellent 17.0% |
| Costa Ricans | 88.0 /100 | #146 | Excellent 17.0% |
| Scotch-Irish | 85.9 /100 | #147 | Excellent 17.1% |
| French Canadians | 85.7 /100 | #148 | Excellent 17.1% |
| Cypriots | 85.7 /100 | #149 | Excellent 17.1% |
| Basques | 85.5 /100 | #150 | Excellent 17.1% |
| Syrians | 83.0 /100 | #151 | Excellent 17.1% |