Ukrainian vs Immigrants from Western Europe Cognitive Disability
COMPARE
Ukrainian
Immigrants from Western Europe
Cognitive Disability
Cognitive Disability Comparison
Ukrainians
Immigrants from Western Europe
16.6%
COGNITIVE DISABILITY
99.4/ 100
METRIC RATING
68th/ 347
METRIC RANK
16.9%
COGNITIVE DISABILITY
94.8/ 100
METRIC RATING
122nd/ 347
METRIC RANK
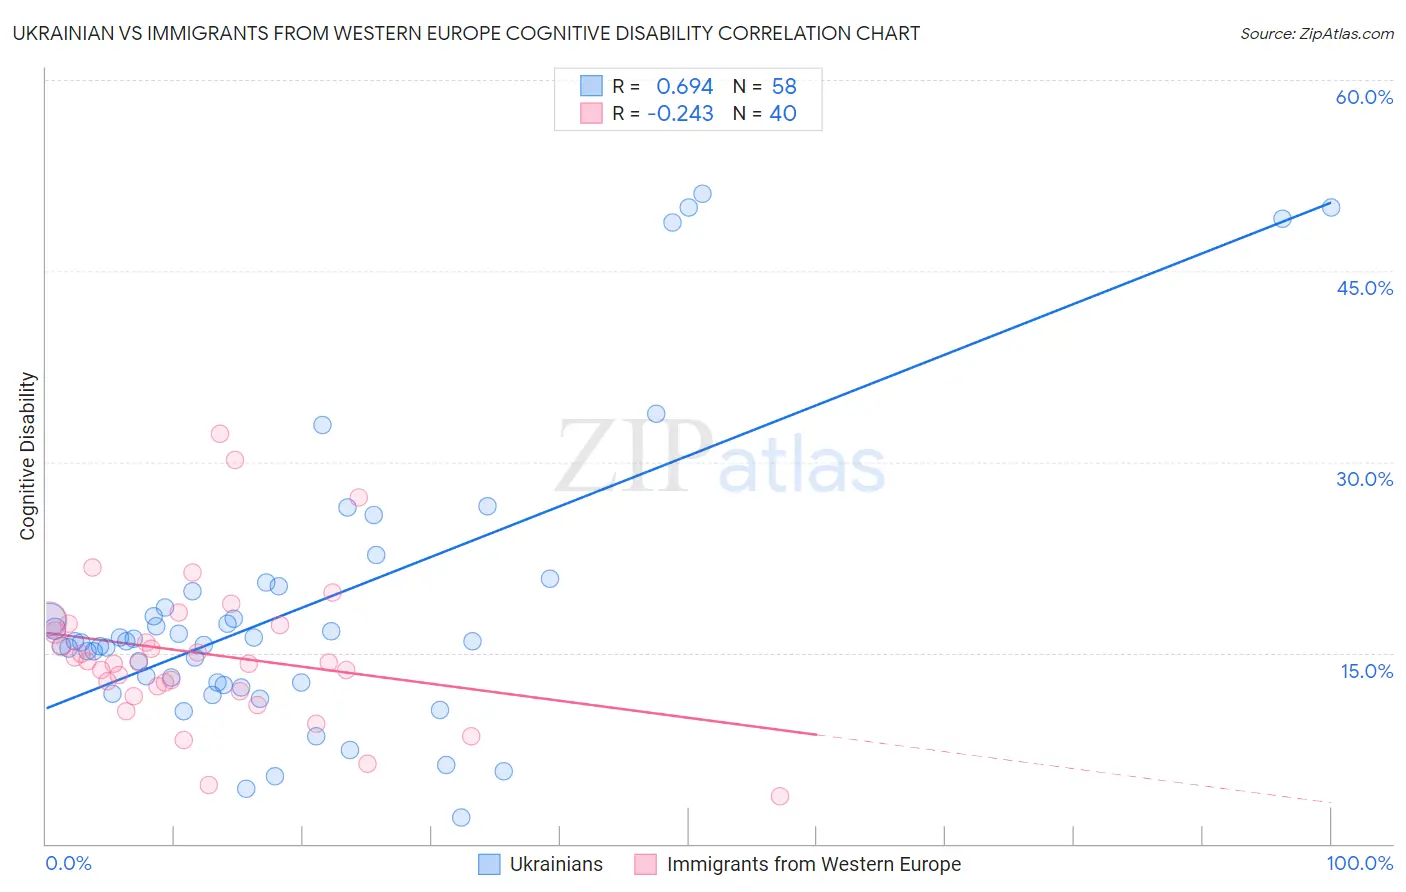
Ukrainian vs Immigrants from Western Europe Cognitive Disability Correlation Chart
The statistical analysis conducted on geographies consisting of 448,632,729 people shows a significant positive correlation between the proportion of Ukrainians and percentage of population with cognitive disability in the United States with a correlation coefficient (R) of 0.694 and weighted average of 16.6%. Similarly, the statistical analysis conducted on geographies consisting of 494,034,294 people shows a weak negative correlation between the proportion of Immigrants from Western Europe and percentage of population with cognitive disability in the United States with a correlation coefficient (R) of -0.243 and weighted average of 16.9%, a difference of 1.7%.
Cognitive Disability Correlation Summary
| Measurement | Ukrainian | Immigrants from Western Europe |
| Minimum | 2.1% | 3.8% |
| Maximum | 51.1% | 32.2% |
| Range | 49.0% | 28.4% |
| Mean | 18.5% | 14.9% |
| Median | 15.9% | 14.3% |
| Interquartile 25% (IQ1) | 12.6% | 12.1% |
| Interquartile 75% (IQ3) | 19.9% | 17.2% |
| Interquartile Range (IQR) | 7.2% | 5.1% |
| Standard Deviation (Sample) | 11.4% | 5.9% |
| Standard Deviation (Population) | 11.3% | 5.8% |
Similar Demographics by Cognitive Disability
Demographics Similar to Ukrainians by Cognitive Disability
In terms of cognitive disability, the demographic groups most similar to Ukrainians are Latvian (16.6%, a difference of 0.040%), Immigrants from Ukraine (16.6%, a difference of 0.080%), Immigrants from Uzbekistan (16.7%, a difference of 0.080%), Immigrants from Sweden (16.7%, a difference of 0.090%), and Immigrants from Belgium (16.7%, a difference of 0.10%).
| Demographics | Rating | Rank | Cognitive Disability |
| Immigrants | England | 99.6 /100 | #61 | Exceptional 16.6% |
| Czechoslovakians | 99.6 /100 | #62 | Exceptional 16.6% |
| Argentineans | 99.6 /100 | #63 | Exceptional 16.6% |
| Venezuelans | 99.6 /100 | #64 | Exceptional 16.6% |
| Colombians | 99.6 /100 | #65 | Exceptional 16.6% |
| Immigrants | Ukraine | 99.5 /100 | #66 | Exceptional 16.6% |
| Latvians | 99.5 /100 | #67 | Exceptional 16.6% |
| Ukrainians | 99.4 /100 | #68 | Exceptional 16.6% |
| Immigrants | Uzbekistan | 99.4 /100 | #69 | Exceptional 16.7% |
| Immigrants | Sweden | 99.4 /100 | #70 | Exceptional 16.7% |
| Immigrants | Belgium | 99.3 /100 | #71 | Exceptional 16.7% |
| Germans | 99.3 /100 | #72 | Exceptional 16.7% |
| Burmese | 99.3 /100 | #73 | Exceptional 16.7% |
| Slavs | 99.3 /100 | #74 | Exceptional 16.7% |
| Estonians | 99.3 /100 | #75 | Exceptional 16.7% |
Demographics Similar to Immigrants from Western Europe by Cognitive Disability
In terms of cognitive disability, the demographic groups most similar to Immigrants from Western Europe are Portuguese (16.9%, a difference of 0.010%), Immigrants from China (16.9%, a difference of 0.020%), Scottish (16.9%, a difference of 0.030%), Turkish (16.9%, a difference of 0.030%), and Scandinavian (16.9%, a difference of 0.090%).
| Demographics | Rating | Rank | Cognitive Disability |
| Yup'ik | 96.9 /100 | #115 | Exceptional 16.9% |
| Inupiat | 96.5 /100 | #116 | Exceptional 16.9% |
| Immigrants | Japan | 96.2 /100 | #117 | Exceptional 16.9% |
| Immigrants | Denmark | 96.2 /100 | #118 | Exceptional 16.9% |
| South Africans | 95.5 /100 | #119 | Exceptional 16.9% |
| Scottish | 95.0 /100 | #120 | Exceptional 16.9% |
| Immigrants | China | 94.9 /100 | #121 | Exceptional 16.9% |
| Immigrants | Western Europe | 94.8 /100 | #122 | Exceptional 16.9% |
| Portuguese | 94.7 /100 | #123 | Exceptional 16.9% |
| Turks | 94.5 /100 | #124 | Exceptional 16.9% |
| Scandinavians | 94.1 /100 | #125 | Exceptional 16.9% |
| Europeans | 93.4 /100 | #126 | Exceptional 17.0% |
| Immigrants | Costa Rica | 93.1 /100 | #127 | Exceptional 17.0% |
| Nicaraguans | 93.0 /100 | #128 | Exceptional 17.0% |
| Immigrants | Uruguay | 92.9 /100 | #129 | Exceptional 17.0% |