Ugandan vs Swedish No Schooling Completed
COMPARE
Ugandan
Swedish
No Schooling Completed
No Schooling Completed Comparison
Ugandans
Swedes
2.0%
NO SCHOOLING COMPLETED
64.6/ 100
METRIC RATING
161st/ 347
METRIC RANK
1.4%
NO SCHOOLING COMPLETED
100.0/ 100
METRIC RATING
8th/ 347
METRIC RANK
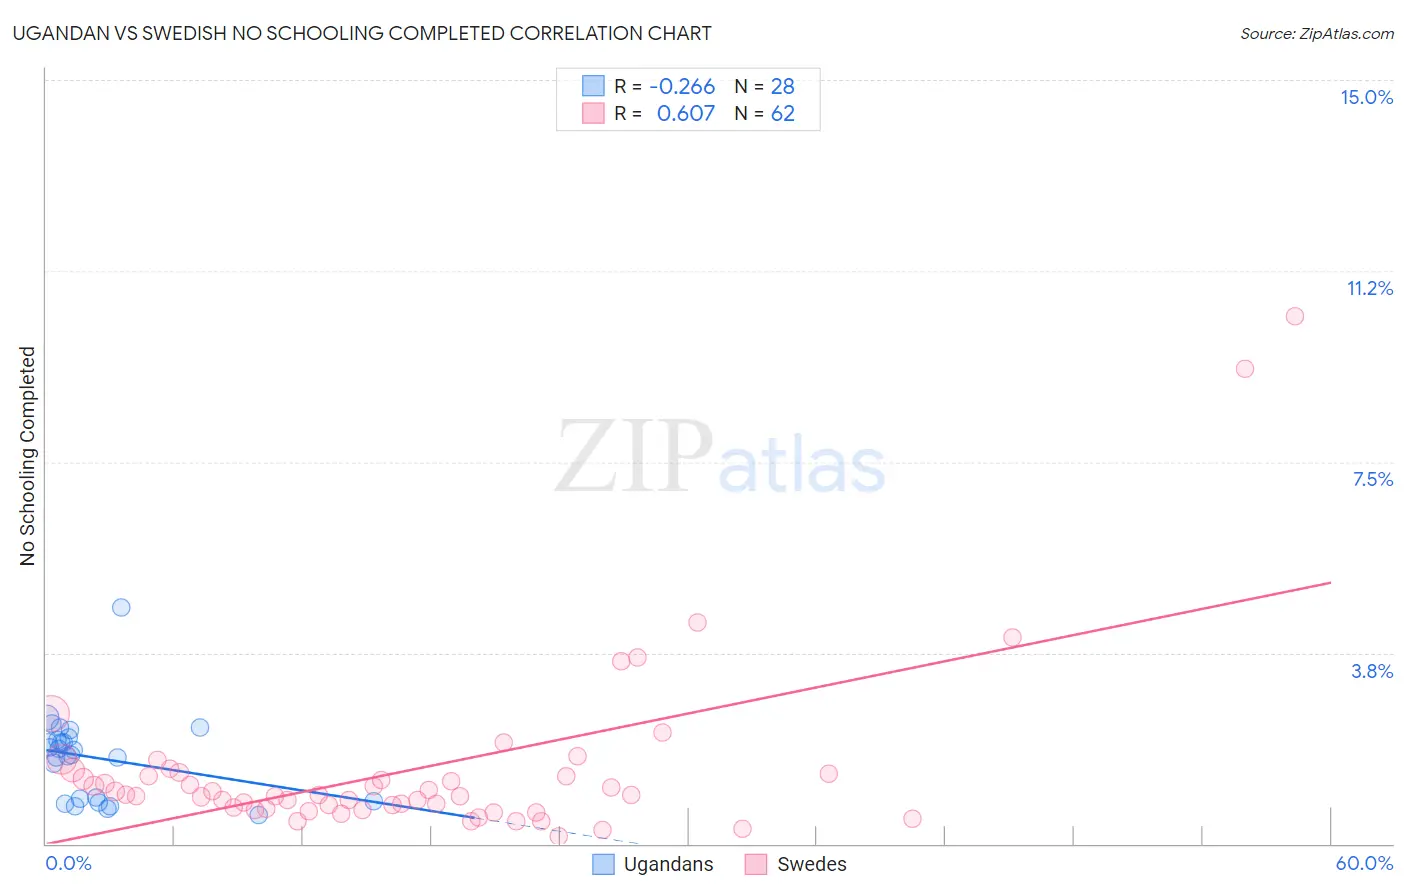
Ugandan vs Swedish No Schooling Completed Correlation Chart
The statistical analysis conducted on geographies consisting of 93,762,117 people shows a weak negative correlation between the proportion of Ugandans and percentage of population with no schooling in the United States with a correlation coefficient (R) of -0.266 and weighted average of 2.0%. Similarly, the statistical analysis conducted on geographies consisting of 523,541,764 people shows a significant positive correlation between the proportion of Swedes and percentage of population with no schooling in the United States with a correlation coefficient (R) of 0.607 and weighted average of 1.4%, a difference of 45.7%.
No Schooling Completed Correlation Summary
| Measurement | Ugandan | Swedish |
| Minimum | 0.56% | 0.14% |
| Maximum | 4.6% | 10.4% |
| Range | 4.1% | 10.2% |
| Mean | 1.7% | 1.5% |
| Median | 1.8% | 0.96% |
| Interquartile 25% (IQ1) | 0.85% | 0.69% |
| Interquartile 75% (IQ3) | 2.1% | 1.4% |
| Interquartile Range (IQR) | 1.2% | 0.68% |
| Standard Deviation (Sample) | 0.84% | 1.8% |
| Standard Deviation (Population) | 0.83% | 1.8% |
Similar Demographics by No Schooling Completed
Demographics Similar to Ugandans by No Schooling Completed
In terms of no schooling completed, the demographic groups most similar to Ugandans are Immigrants from Brazil (2.1%, a difference of 0.11%), Kenyan (2.0%, a difference of 0.17%), Immigrants from Spain (2.0%, a difference of 0.29%), Immigrants from Korea (2.0%, a difference of 0.33%), and Albanian (2.1%, a difference of 0.35%).
| Demographics | Rating | Rank | No Schooling Completed |
| Immigrants | Venezuela | 68.5 /100 | #154 | Good 2.0% |
| Immigrants | Russia | 67.6 /100 | #155 | Good 2.0% |
| Chileans | 67.2 /100 | #156 | Good 2.0% |
| Immigrants | Sri Lanka | 67.0 /100 | #157 | Good 2.0% |
| Immigrants | Korea | 66.7 /100 | #158 | Good 2.0% |
| Immigrants | Spain | 66.4 /100 | #159 | Good 2.0% |
| Kenyans | 65.7 /100 | #160 | Good 2.0% |
| Ugandans | 64.6 /100 | #161 | Good 2.0% |
| Immigrants | Brazil | 63.8 /100 | #162 | Good 2.1% |
| Albanians | 62.2 /100 | #163 | Good 2.1% |
| Comanche | 60.7 /100 | #164 | Good 2.1% |
| Brazilians | 60.2 /100 | #165 | Good 2.1% |
| Dutch West Indians | 59.9 /100 | #166 | Average 2.1% |
| Egyptians | 59.2 /100 | #167 | Average 2.1% |
| Cheyenne | 58.6 /100 | #168 | Average 2.1% |
Demographics Similar to Swedes by No Schooling Completed
In terms of no schooling completed, the demographic groups most similar to Swedes are Scottish (1.4%, a difference of 0.53%), Dutch (1.4%, a difference of 1.3%), English (1.4%, a difference of 1.5%), Lithuanian (1.4%, a difference of 2.2%), and Irish (1.4%, a difference of 2.2%).
| Demographics | Rating | Rank | No Schooling Completed |
| Yup'ik | 100.0 /100 | #1 | Exceptional 1.2% |
| Slovaks | 100.0 /100 | #2 | Exceptional 1.3% |
| Norwegians | 100.0 /100 | #3 | Exceptional 1.3% |
| Germans | 100.0 /100 | #4 | Exceptional 1.4% |
| Slovenes | 100.0 /100 | #5 | Exceptional 1.4% |
| Carpatho Rusyns | 100.0 /100 | #6 | Exceptional 1.4% |
| English | 100.0 /100 | #7 | Exceptional 1.4% |
| Swedes | 100.0 /100 | #8 | Exceptional 1.4% |
| Scottish | 100.0 /100 | #9 | Exceptional 1.4% |
| Dutch | 100.0 /100 | #10 | Exceptional 1.4% |
| Lithuanians | 100.0 /100 | #11 | Exceptional 1.4% |
| Irish | 100.0 /100 | #12 | Exceptional 1.4% |
| Poles | 100.0 /100 | #13 | Exceptional 1.4% |
| Scotch-Irish | 100.0 /100 | #14 | Exceptional 1.5% |
| Tlingit-Haida | 100.0 /100 | #15 | Exceptional 1.5% |