Immigrants from Cambodia vs Israeli Ambulatory Disability
COMPARE
Immigrants from Cambodia
Israeli
Ambulatory Disability
Ambulatory Disability Comparison
Immigrants from Cambodia
Israelis
6.2%
AMBULATORY DISABILITY
21.5/ 100
METRIC RATING
200th/ 347
METRIC RANK
5.7%
AMBULATORY DISABILITY
99.6/ 100
METRIC RATING
66th/ 347
METRIC RANK
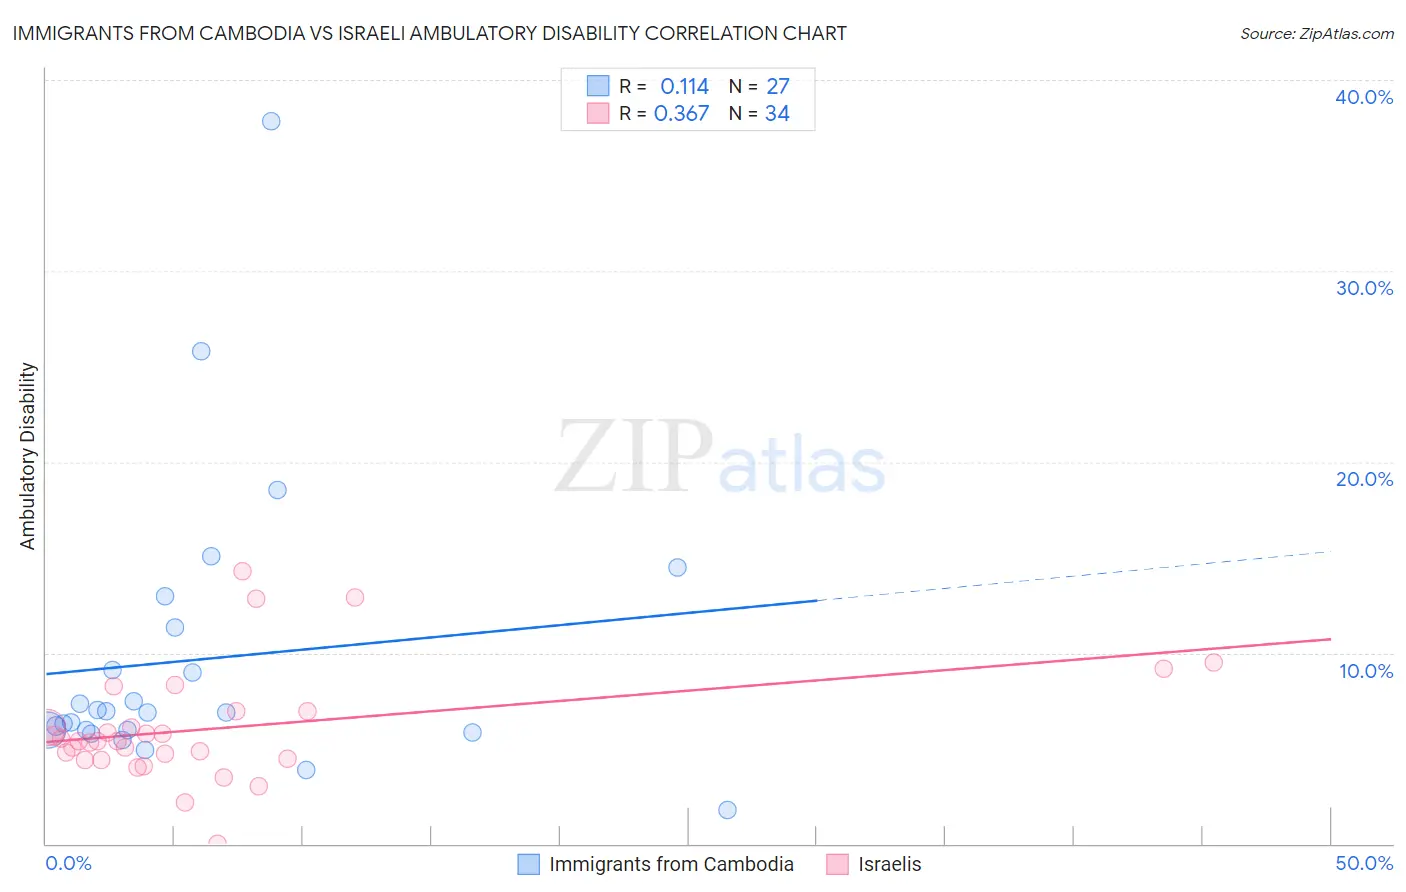
Immigrants from Cambodia vs Israeli Ambulatory Disability Correlation Chart
The statistical analysis conducted on geographies consisting of 205,130,824 people shows a poor positive correlation between the proportion of Immigrants from Cambodia and percentage of population with ambulatory disability in the United States with a correlation coefficient (R) of 0.114 and weighted average of 6.2%. Similarly, the statistical analysis conducted on geographies consisting of 211,116,012 people shows a mild positive correlation between the proportion of Israelis and percentage of population with ambulatory disability in the United States with a correlation coefficient (R) of 0.367 and weighted average of 5.7%, a difference of 10.0%.
Ambulatory Disability Correlation Summary
| Measurement | Immigrants from Cambodia | Israeli |
| Minimum | 1.8% | 0.023% |
| Maximum | 37.9% | 14.3% |
| Range | 36.1% | 14.3% |
| Mean | 9.7% | 6.0% |
| Median | 6.9% | 5.4% |
| Interquartile 25% (IQ1) | 5.9% | 4.4% |
| Interquartile 75% (IQ3) | 11.3% | 6.9% |
| Interquartile Range (IQR) | 5.4% | 2.5% |
| Standard Deviation (Sample) | 7.6% | 3.0% |
| Standard Deviation (Population) | 7.4% | 2.9% |
Similar Demographics by Ambulatory Disability
Demographics Similar to Immigrants from Cambodia by Ambulatory Disability
In terms of ambulatory disability, the demographic groups most similar to Immigrants from Cambodia are Italian (6.2%, a difference of 0.080%), Immigrants from Central America (6.2%, a difference of 0.11%), Albanian (6.2%, a difference of 0.14%), Immigrants from Bangladesh (6.2%, a difference of 0.22%), and Immigrants from Ukraine (6.2%, a difference of 0.25%).
| Demographics | Rating | Rank | Ambulatory Disability |
| Guatemalans | 30.0 /100 | #193 | Fair 6.2% |
| Alaska Natives | 29.8 /100 | #194 | Fair 6.2% |
| Belgians | 28.6 /100 | #195 | Fair 6.2% |
| Malaysians | 28.2 /100 | #196 | Fair 6.2% |
| Poles | 26.3 /100 | #197 | Fair 6.2% |
| Immigrants | Bangladesh | 24.6 /100 | #198 | Fair 6.2% |
| Italians | 22.6 /100 | #199 | Fair 6.2% |
| Immigrants | Cambodia | 21.5 /100 | #200 | Fair 6.2% |
| Immigrants | Central America | 20.1 /100 | #201 | Fair 6.2% |
| Albanians | 19.7 /100 | #202 | Poor 6.2% |
| Immigrants | Ukraine | 18.4 /100 | #203 | Poor 6.2% |
| Immigrants | Congo | 18.2 /100 | #204 | Poor 6.2% |
| Slovenes | 18.0 /100 | #205 | Poor 6.2% |
| Finns | 17.2 /100 | #206 | Poor 6.2% |
| Alsatians | 15.1 /100 | #207 | Poor 6.3% |
Demographics Similar to Israelis by Ambulatory Disability
In terms of ambulatory disability, the demographic groups most similar to Israelis are Immigrants from Uganda (5.7%, a difference of 0.010%), Sri Lankan (5.7%, a difference of 0.040%), Immigrants from Switzerland (5.7%, a difference of 0.090%), Laotian (5.7%, a difference of 0.12%), and Immigrants from France (5.6%, a difference of 0.25%).
| Demographics | Rating | Rank | Ambulatory Disability |
| Immigrants | Afghanistan | 99.8 /100 | #59 | Exceptional 5.6% |
| Immigrants | Lithuania | 99.8 /100 | #60 | Exceptional 5.6% |
| Immigrants | Belgium | 99.7 /100 | #61 | Exceptional 5.6% |
| Immigrants | Spain | 99.7 /100 | #62 | Exceptional 5.6% |
| Immigrants | France | 99.7 /100 | #63 | Exceptional 5.6% |
| Laotians | 99.7 /100 | #64 | Exceptional 5.7% |
| Immigrants | Switzerland | 99.7 /100 | #65 | Exceptional 5.7% |
| Israelis | 99.6 /100 | #66 | Exceptional 5.7% |
| Immigrants | Uganda | 99.6 /100 | #67 | Exceptional 5.7% |
| Sri Lankans | 99.6 /100 | #68 | Exceptional 5.7% |
| Peruvians | 99.5 /100 | #69 | Exceptional 5.7% |
| Sierra Leoneans | 99.4 /100 | #70 | Exceptional 5.7% |
| Immigrants | Peru | 99.4 /100 | #71 | Exceptional 5.7% |
| Brazilians | 99.4 /100 | #72 | Exceptional 5.7% |
| Immigrants | Northern Africa | 99.4 /100 | #73 | Exceptional 5.7% |