Ugandan vs Immigrants from Sweden Cognitive Disability

COMPARE

Ugandan
Race
Ancestry
AfghanAfricanAlaska NativeAlaskan AthabascanAlbanianAleutAlsatianAmericanApacheArabArapahoArgentineanArmenianAssyrian/Chaldean/SyriacAustralianAustrianBahamianBangladeshiBarbadianBasqueBelgianBelizeanBermudanBhutaneseBlackfeetBolivianBrazilianBritishBritish West IndianBulgarianBurmeseCajunCambodianCanadianCape VerdeanCarpatho RusynCelticCentral AmericanCentral American IndianCherokeeCheyenneChickasawChileanChineseChippewaChoctawColombianColvilleComancheCosta RicanCreeCreekCroatianCrowCubanCypriotCzechCzechoslovakianDanishDelawareDominicanDutchDutch West IndianEastern EuropeanEcuadorianEgyptianEnglishEstonianEthiopianEuropeanFijianFilipinoFinnishFrenchFrench American IndianFrench CanadianGermanGerman RussianGhanaianGreekGuamanian/ChamorroGuatemalanGuyaneseHaitianHmongHonduranHopiHoumaHungarianIcelanderIndian (Asian)IndonesianInupiatIranianIraqiIrishIroquoisIsraeliItalianJamaicanJapaneseJordanianKenyanKiowaKoreanLaotianLatvianLebaneseLiberianLithuanianLumbeeLuxembourgerMacedonianMalaysianMalteseMarshalleseMenomineeMexicanMexican American IndianMongolianMoroccanNative HawaiianNavajoNepaleseNew ZealanderNicaraguanNigerianNorthern EuropeanNorwegianOkinawanOsageOttawaPaiutePakistaniPalestinianPanamanianParaguayanPennsylvania GermanPeruvianPimaPolishPortuguesePotawatomiPuebloPuerto RicanPuget Sound SalishRomanianRussianSalvadoranSamoanScandinavianScotch-IrishScottishSeminoleSenegaleseSerbianShoshoneSierra LeoneanSiouxSlavicSlovakSloveneSomaliSouth AfricanSouth AmericanSouth American IndianSoviet UnionSpaniardSpanishSpanish AmericanSpanish American IndianSri LankanSubsaharan AfricanSudaneseSwedishSwissSyrianTaiwaneseThaiTlingit-HaidaTohono O'OdhamTonganTrinidadian and TobagonianTsimshianTurkishU.S. Virgin IslanderUgandanUkrainianUruguayanUteVenezuelanVietnameseWelshWest IndianYakamaYaquiYugoslavianYumanYup'ikZimbabwean
Immigration
NonimmigrantsImmigrantsAfghanistanAfricaAlbaniaArgentinaArmeniaAsiaAustraliaAustriaBahamasBangladeshBarbadosBelarusBelgiumBelizeBoliviaBosnia and HerzegovinaBrazilBulgariaBurma/MyanmarCabo VerdeCambodiaCameroonCanadaCaribbeanCentral AmericaChileChinaColombiaCongoCosta RicaCroatiaCubaCzechoslovakiaDenmarkDominicaDominican RepublicEastern AfricaEastern AsiaEastern EuropeEcuadorEgyptEl SalvadorEnglandEritreaEthiopiaEuropeFijiFranceGermanyGhanaGreeceGrenadaGuatemalaGuyanaHaitiHondurasHong KongHungaryIndiaIndonesiaIranIraqIrelandIsraelItalyJamaicaJapanJordanKazakhstanKenyaKoreaKuwaitLaosLatin AmericaLatviaLebanonLiberiaLithuaniaMalaysiaMexicoMicronesiaMiddle AfricaMoldovaMoroccoNepalNetherlandsNicaraguaNigeriaNorth AmericaNorth MacedoniaNorthern AfricaNorthern EuropeNorwayOceaniaPakistanPanamaPeruPhilippinesPolandPortugalRomaniaRussiaSaudi ArabiaScotlandSenegalSerbiaSierra LeoneSingaporeSomaliaSouth AfricaSouth AmericaSouth Central AsiaSouth Eastern AsiaSouthern EuropeSpainSri LankaSt. Vincent and the GrenadinesSudanSwitzerlandSyriaTaiwanThailandTrinidad and TobagoTurkeyUgandaUkraineUruguayUzbekistanVenezuelaVietnamWest IndiesWestern AfricaWestern AsiaWestern EuropeYemenZaireZimbabweAzores
Immigrants from Sweden
Race
Ancestry
AfghanAfricanAlaska NativeAlaskan AthabascanAlbanianAleutAlsatianAmericanApacheArabArapahoArgentineanArmenianAssyrian/Chaldean/SyriacAustralianAustrianBahamianBangladeshiBarbadianBasqueBelgianBelizeanBermudanBhutaneseBlackfeetBolivianBrazilianBritishBritish West IndianBulgarianBurmeseCajunCambodianCanadianCape VerdeanCarpatho RusynCelticCentral AmericanCentral American IndianCherokeeCheyenneChickasawChileanChineseChippewaChoctawColombianColvilleComancheCosta RicanCreeCreekCroatianCrowCubanCypriotCzechCzechoslovakianDanishDelawareDominicanDutchDutch West IndianEastern EuropeanEcuadorianEgyptianEnglishEstonianEthiopianEuropeanFijianFilipinoFinnishFrenchFrench American IndianFrench CanadianGermanGerman RussianGhanaianGreekGuamanian/ChamorroGuatemalanGuyaneseHaitianHmongHonduranHopiHoumaHungarianIcelanderIndian (Asian)IndonesianInupiatIranianIraqiIrishIroquoisIsraeliItalianJamaicanJapaneseJordanianKenyanKiowaKoreanLaotianLatvianLebaneseLiberianLithuanianLumbeeLuxembourgerMacedonianMalaysianMalteseMarshalleseMenomineeMexicanMexican American IndianMongolianMoroccanNative HawaiianNavajoNepaleseNew ZealanderNicaraguanNigerianNorthern EuropeanNorwegianOkinawanOsageOttawaPaiutePakistaniPalestinianPanamanianParaguayanPennsylvania GermanPeruvianPimaPolishPortuguesePotawatomiPuebloPuerto RicanPuget Sound SalishRomanianRussianSalvadoranSamoanScandinavianScotch-IrishScottishSeminoleSenegaleseSerbianShoshoneSierra LeoneanSiouxSlavicSlovakSloveneSomaliSouth AfricanSouth AmericanSouth American IndianSoviet UnionSpaniardSpanishSpanish AmericanSpanish American IndianSri LankanSubsaharan AfricanSudaneseSwedishSwissSyrianTaiwaneseThaiTlingit-HaidaTohono O'OdhamTonganTrinidadian and TobagonianTsimshianTurkishU.S. Virgin IslanderUkrainianUruguayanUteVenezuelanVietnameseWelshWest IndianYakamaYaquiYugoslavianYumanYup'ikZimbabwean
Immigration
NonimmigrantsImmigrantsAfghanistanAfricaAlbaniaArgentinaArmeniaAsiaAustraliaAustriaBahamasBangladeshBarbadosBelarusBelgiumBelizeBoliviaBosnia and HerzegovinaBrazilBulgariaBurma/MyanmarCabo VerdeCambodiaCameroonCanadaCaribbeanCentral AmericaChileChinaColombiaCongoCosta RicaCroatiaCubaCzechoslovakiaDenmarkDominicaDominican RepublicEastern AfricaEastern AsiaEastern EuropeEcuadorEgyptEl SalvadorEnglandEritreaEthiopiaEuropeFijiFranceGermanyGhanaGreeceGrenadaGuatemalaGuyanaHaitiHondurasHong KongHungaryIndiaIndonesiaIranIraqIrelandIsraelItalyJamaicaJapanJordanKazakhstanKenyaKoreaKuwaitLaosLatin AmericaLatviaLebanonLiberiaLithuaniaMalaysiaMexicoMicronesiaMiddle AfricaMoldovaMoroccoNepalNetherlandsNicaraguaNigeriaNorth AmericaNorth MacedoniaNorthern AfricaNorthern EuropeNorwayOceaniaPakistanPanamaPeruPhilippinesPolandPortugalRomaniaRussiaSaudi ArabiaScotlandSenegalSerbiaSierra LeoneSingaporeSomaliaSouth AfricaSouth AmericaSouth Central AsiaSouth Eastern AsiaSouthern EuropeSpainSri LankaSt. Vincent and the GrenadinesSudanSwedenSwitzerlandSyriaTaiwanThailandTrinidad and TobagoTurkeyUgandaUkraineUruguayUzbekistanVenezuelaVietnamWest IndiesWestern AfricaWestern AsiaWestern EuropeYemenZaireZimbabweAzores
Cognitive Disability
Income
Poverty
Unemployment
Labor Participation
Family Structure
Vehicle Availability
Education Level
Disability

Cognitive Disability Comparison

Ugandans

Immigrants from Sweden

Tragic
Exceptional
18.3%
COGNITIVE DISABILITY
0.0/ 100
METRIC RATING
307th/ 347
METRIC RANK
16.7%
COGNITIVE DISABILITY
99.4/ 100
METRIC RATING
70th/ 347
METRIC RANK

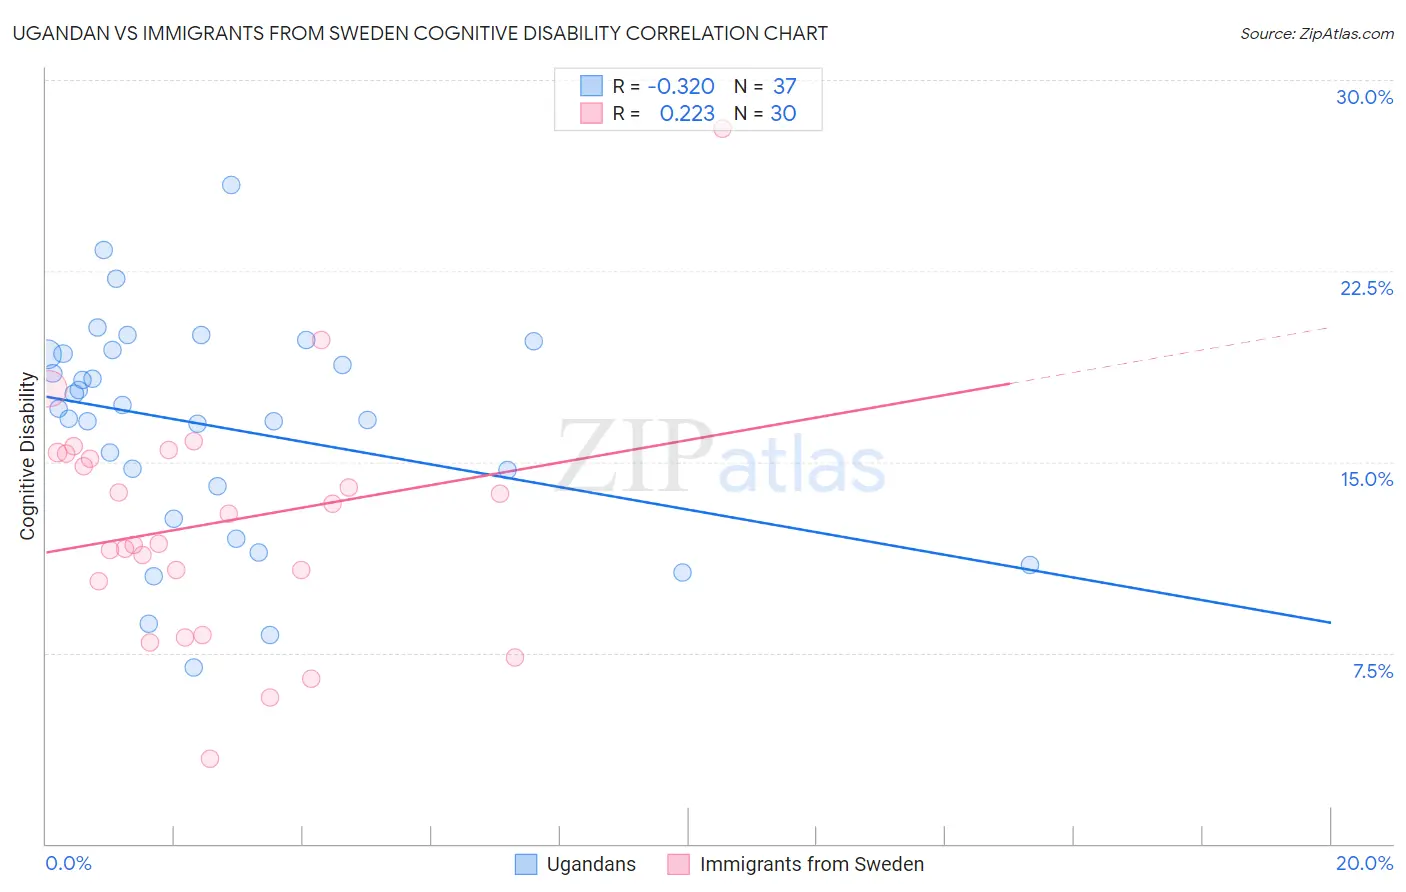
Ugandan vs Immigrants from Sweden Cognitive Disability Correlation Chart

The statistical analysis conducted on geographies consisting of 94,018,576 people shows a mild negative correlation between the proportion of Ugandans and percentage of population with cognitive disability in the United States with a correlation coefficient (R) of -0.320 and weighted average of 18.3%. Similarly, the statistical analysis conducted on geographies consisting of 164,746,937 people shows a weak positive correlation between the proportion of Immigrants from Sweden and percentage of population with cognitive disability in the United States with a correlation coefficient (R) of 0.223 and weighted average of 16.7%, a difference of 10.1%.
Ugandan vs Immigrants from Sweden Cognitive Disability

Cognitive Disability Correlation Summary

MeasurementUgandanImmigrants from Sweden
Minimum6.9%3.4%
Maximum25.9%28.1%
Range18.9%24.7%
Mean16.4%12.6%
Median17.1%12.4%
Interquartile 25% (IQ1)13.4%10.3%
Interquartile 75% (IQ3)19.3%15.3%
Interquartile Range (IQR)5.9%5.0%
Standard Deviation (Sample)4.3%4.8%
Standard Deviation (Population)4.2%4.7%

Similar Demographics by Cognitive Disability

Demographics Similar to Ugandans by Cognitive Disability

In terms of cognitive disability, the demographic groups most similar to Ugandans are Seminole (18.3%, a difference of 0.0%), Colville (18.3%, a difference of 0.010%), Immigrants from Western Africa (18.4%, a difference of 0.090%), Immigrants from Eastern Africa (18.4%, a difference of 0.12%), and Immigrants from Eritrea (18.3%, a difference of 0.13%).
DemographicsRating | RankCognitive Disability
Creek
0.0
/100
|
#300
Tragic
18.3%
Immigrants | Ghana
0.0
/100
|
#301
Tragic
18.3%
Barbadians
0.0
/100
|
#302
Tragic
18.3%
Immigrants | Kenya
0.0
/100
|
#303
Tragic
18.3%
Immigrants | Eritrea
0.0
/100
|
#304
Tragic
18.3%
Colville
0.0
/100
|
#305
Tragic
18.3%
Seminole
0.0
/100
|
#306
Tragic
18.3%
Ugandans
0.0
/100
|
#307
Tragic
18.3%
Immigrants | Western Africa
0.0
/100
|
#308
Tragic
18.4%
Immigrants | Eastern Africa
0.0
/100
|
#309
Tragic
18.4%
Choctaw
0.0
/100
|
#310
Tragic
18.4%
Hmong
0.0
/100
|
#311
Tragic
18.4%
Chickasaw
0.0
/100
|
#312
Tragic
18.5%
Yaqui
0.0
/100
|
#313
Tragic
18.5%
Sub-Saharan Africans
0.0
/100
|
#314
Tragic
18.5%

Demographics Similar to Immigrants from Sweden by Cognitive Disability

In terms of cognitive disability, the demographic groups most similar to Immigrants from Sweden are Immigrants from Uzbekistan (16.7%, a difference of 0.010%), Immigrants from Belgium (16.7%, a difference of 0.010%), German (16.7%, a difference of 0.020%), Burmese (16.7%, a difference of 0.030%), and Slavic (16.7%, a difference of 0.030%).
DemographicsRating | RankCognitive Disability
Argentineans
99.6
/100
|
#63
Exceptional
16.6%
Venezuelans
99.6
/100
|
#64
Exceptional
16.6%
Colombians
99.6
/100
|
#65
Exceptional
16.6%
Immigrants | Ukraine
99.5
/100
|
#66
Exceptional
16.6%
Latvians
99.5
/100
|
#67
Exceptional
16.6%
Ukrainians
99.4
/100
|
#68
Exceptional
16.6%
Immigrants | Uzbekistan
99.4
/100
|
#69
Exceptional
16.7%
Immigrants | Sweden
99.4
/100
|
#70
Exceptional
16.7%
Immigrants | Belgium
99.3
/100
|
#71
Exceptional
16.7%
Germans
99.3
/100
|
#72
Exceptional
16.7%
Burmese
99.3
/100
|
#73
Exceptional
16.7%
Slavs
99.3
/100
|
#74
Exceptional
16.7%
Estonians
99.3
/100
|
#75
Exceptional
16.7%
Immigrants | Serbia
99.3
/100
|
#76
Exceptional
16.7%
Immigrants | Hungary
99.3
/100
|
#77
Exceptional
16.7%