Immigrants from Singapore vs Immigrants from Africa Hearing Disability
COMPARE
Immigrants from Singapore
Immigrants from Africa
Hearing Disability
Hearing Disability Comparison
Immigrants from Singapore
Immigrants from Africa
2.6%
HEARING DISABILITY
99.3/ 100
METRIC RATING
48th/ 347
METRIC RANK
2.7%
HEARING DISABILITY
98.0/ 100
METRIC RATING
68th/ 347
METRIC RANK
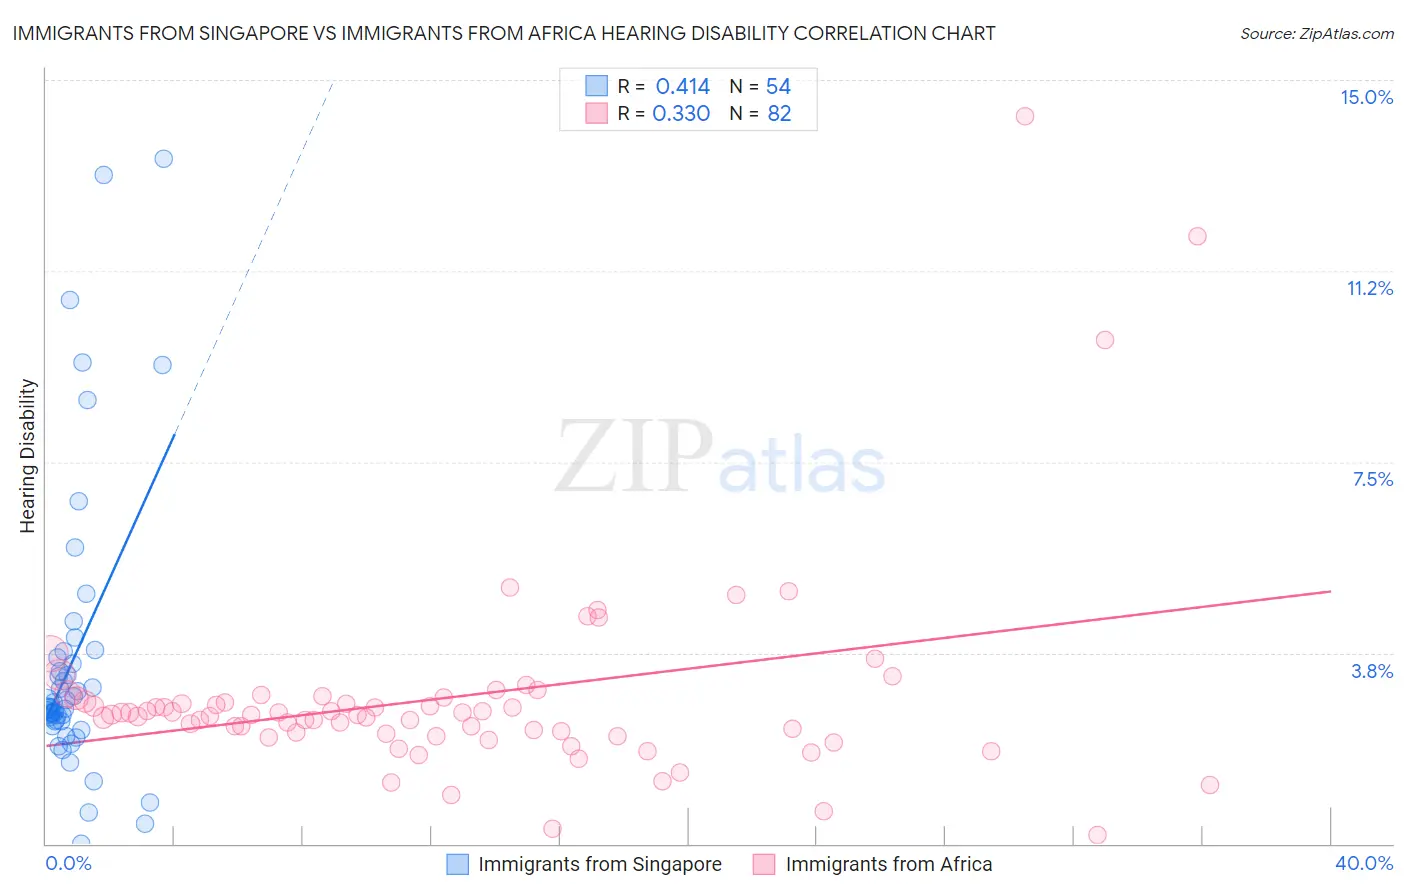
Immigrants from Singapore vs Immigrants from Africa Hearing Disability Correlation Chart
The statistical analysis conducted on geographies consisting of 137,507,103 people shows a moderate positive correlation between the proportion of Immigrants from Singapore and percentage of population with hearing disability in the United States with a correlation coefficient (R) of 0.414 and weighted average of 2.6%. Similarly, the statistical analysis conducted on geographies consisting of 469,129,407 people shows a mild positive correlation between the proportion of Immigrants from Africa and percentage of population with hearing disability in the United States with a correlation coefficient (R) of 0.330 and weighted average of 2.7%, a difference of 2.8%.
Hearing Disability Correlation Summary
| Measurement | Immigrants from Singapore | Immigrants from Africa |
| Minimum | 0.0083% | 0.17% |
| Maximum | 13.5% | 14.3% |
| Range | 13.5% | 14.1% |
| Mean | 3.6% | 2.9% |
| Median | 2.7% | 2.5% |
| Interquartile 25% (IQ1) | 2.4% | 2.2% |
| Interquartile 75% (IQ3) | 3.7% | 2.9% |
| Interquartile Range (IQR) | 1.3% | 0.70% |
| Standard Deviation (Sample) | 2.9% | 2.0% |
| Standard Deviation (Population) | 2.8% | 2.0% |
Demographics Similar to Immigrants from Singapore and Immigrants from Africa by Hearing Disability
In terms of hearing disability, the demographic groups most similar to Immigrants from Singapore are Immigrants from South America (2.7%, a difference of 0.12%), Paraguayan (2.7%, a difference of 0.31%), Immigrants from Hong Kong (2.7%, a difference of 0.38%), Jamaican (2.7%, a difference of 0.74%), and Immigrants from Eastern Asia (2.7%, a difference of 0.81%). Similarly, the demographic groups most similar to Immigrants from Africa are Egyptian (2.7%, a difference of 0.13%), Immigrants from Belize (2.7%, a difference of 0.36%), Immigrants from Nepal (2.7%, a difference of 0.48%), Immigrants from Sri Lanka (2.7%, a difference of 0.57%), and Indian (Asian) (2.7%, a difference of 0.62%).
| Demographics | Rating | Rank | Hearing Disability |
| Immigrants | Singapore | 99.3 /100 | #48 | Exceptional 2.6% |
| Immigrants | South America | 99.2 /100 | #49 | Exceptional 2.7% |
| Paraguayans | 99.2 /100 | #50 | Exceptional 2.7% |
| Immigrants | Hong Kong | 99.2 /100 | #51 | Exceptional 2.7% |
| Jamaicans | 99.0 /100 | #52 | Exceptional 2.7% |
| Immigrants | Eastern Asia | 99.0 /100 | #53 | Exceptional 2.7% |
| Ethiopians | 99.0 /100 | #54 | Exceptional 2.7% |
| Immigrants | Ethiopia | 99.0 /100 | #55 | Exceptional 2.7% |
| Immigrants | Nicaragua | 99.0 /100 | #56 | Exceptional 2.7% |
| South Americans | 99.0 /100 | #57 | Exceptional 2.7% |
| Immigrants | Peru | 98.6 /100 | #58 | Exceptional 2.7% |
| Immigrants | Eritrea | 98.5 /100 | #59 | Exceptional 2.7% |
| Immigrants | Egypt | 98.5 /100 | #60 | Exceptional 2.7% |
| Immigrants | Uzbekistan | 98.4 /100 | #61 | Exceptional 2.7% |
| Immigrants | Colombia | 98.4 /100 | #62 | Exceptional 2.7% |
| Indians (Asian) | 98.4 /100 | #63 | Exceptional 2.7% |
| Immigrants | Sri Lanka | 98.4 /100 | #64 | Exceptional 2.7% |
| Immigrants | Nepal | 98.3 /100 | #65 | Exceptional 2.7% |
| Immigrants | Belize | 98.2 /100 | #66 | Exceptional 2.7% |
| Egyptians | 98.1 /100 | #67 | Exceptional 2.7% |
| Immigrants | Africa | 98.0 /100 | #68 | Exceptional 2.7% |