South American Indian vs Immigrants from Sierra Leone Disability Age 35 to 64
COMPARE
South American Indian
Immigrants from Sierra Leone
Disability Age 35 to 64
Disability Age 35 to 64 Comparison
South American Indians
Immigrants from Sierra Leone
10.9%
DISABILITY AGE 35 TO 64
83.5/ 100
METRIC RATING
146th/ 347
METRIC RANK
11.0%
DISABILITY AGE 35 TO 64
76.2/ 100
METRIC RATING
156th/ 347
METRIC RANK
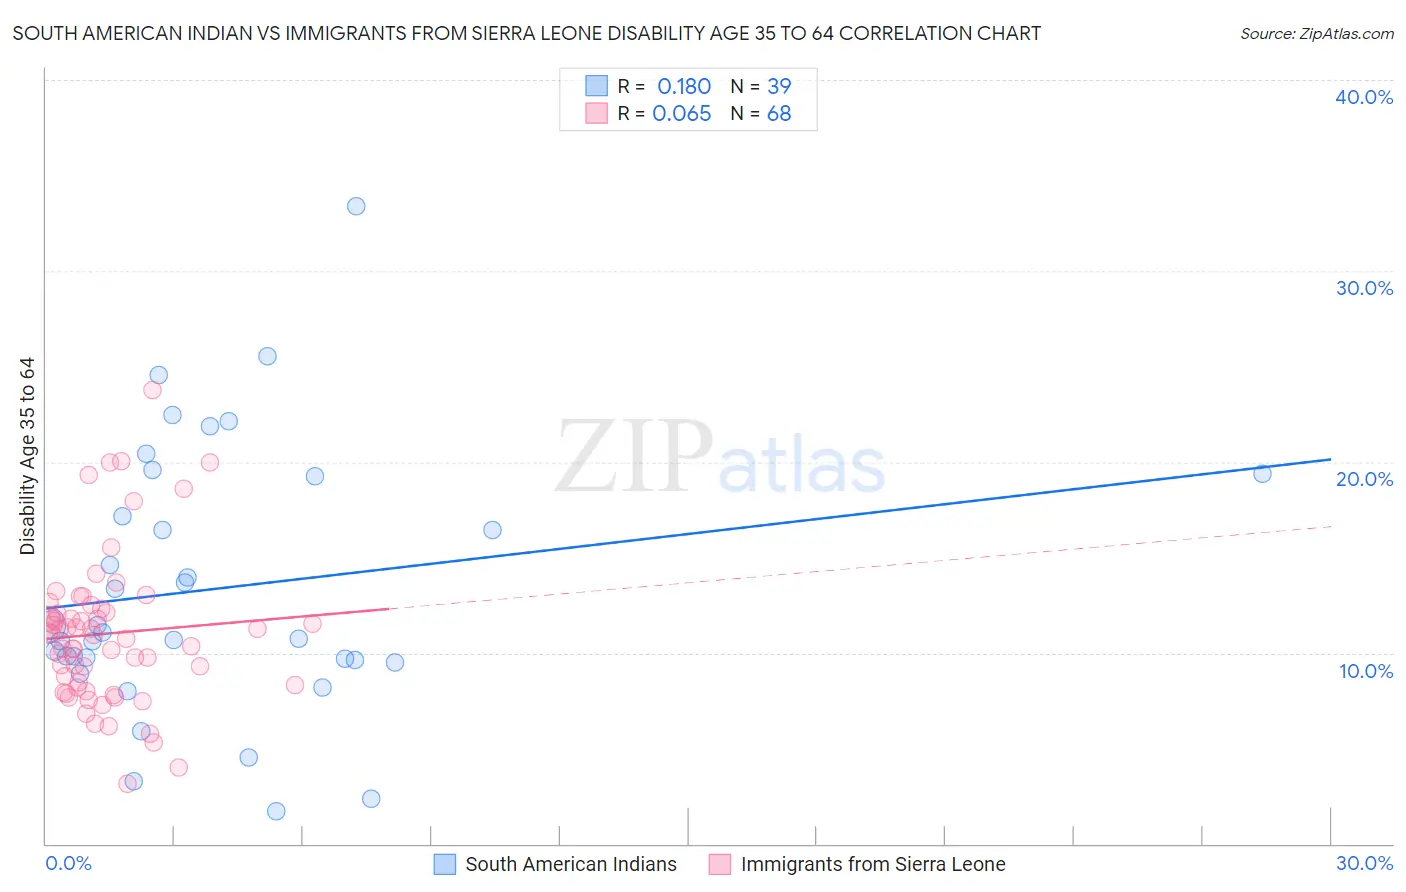
South American Indian vs Immigrants from Sierra Leone Disability Age 35 to 64 Correlation Chart
The statistical analysis conducted on geographies consisting of 164,539,388 people shows a poor positive correlation between the proportion of South American Indians and percentage of population with a disability between the ages 34 and 64 in the United States with a correlation coefficient (R) of 0.180 and weighted average of 10.9%. Similarly, the statistical analysis conducted on geographies consisting of 101,638,803 people shows a slight positive correlation between the proportion of Immigrants from Sierra Leone and percentage of population with a disability between the ages 34 and 64 in the United States with a correlation coefficient (R) of 0.065 and weighted average of 11.0%, a difference of 0.95%.
Disability Age 35 to 64 Correlation Summary
| Measurement | South American Indian | Immigrants from Sierra Leone |
| Minimum | 1.7% | 3.2% |
| Maximum | 33.4% | 23.8% |
| Range | 31.7% | 20.6% |
| Mean | 13.4% | 11.0% |
| Median | 11.1% | 11.0% |
| Interquartile 25% (IQ1) | 9.6% | 8.3% |
| Interquartile 75% (IQ3) | 19.3% | 12.2% |
| Interquartile Range (IQR) | 9.6% | 3.9% |
| Standard Deviation (Sample) | 6.9% | 3.9% |
| Standard Deviation (Population) | 6.8% | 3.9% |
Demographics Similar to South American Indians and Immigrants from Sierra Leone by Disability Age 35 to 64
In terms of disability age 35 to 64, the demographic groups most similar to South American Indians are Immigrants from Eritrea (10.9%, a difference of 0.020%), Arab (10.9%, a difference of 0.12%), Immigrants from Bangladesh (10.9%, a difference of 0.34%), Immigrants from Cameroon (10.9%, a difference of 0.34%), and Syrian (11.0%, a difference of 0.51%). Similarly, the demographic groups most similar to Immigrants from Sierra Leone are Moroccan (11.0%, a difference of 0.020%), Immigrants from Canada (11.0%, a difference of 0.060%), Immigrants from England (11.0%, a difference of 0.13%), Guyanese (11.0%, a difference of 0.13%), and Immigrants from North America (11.0%, a difference of 0.14%).
| Demographics | Rating | Rank | Disability Age 35 to 64 |
| Australians | 90.7 /100 | #141 | Exceptional 10.8% |
| Immigrants | Saudi Arabia | 90.6 /100 | #142 | Exceptional 10.8% |
| Sierra Leoneans | 89.7 /100 | #143 | Excellent 10.8% |
| Lithuanians | 88.7 /100 | #144 | Excellent 10.8% |
| Immigrants | Bangladesh | 85.6 /100 | #145 | Excellent 10.9% |
| South American Indians | 83.5 /100 | #146 | Excellent 10.9% |
| Immigrants | Eritrea | 83.4 /100 | #147 | Excellent 10.9% |
| Arabs | 82.7 /100 | #148 | Excellent 10.9% |
| Immigrants | Cameroon | 81.1 /100 | #149 | Excellent 10.9% |
| Syrians | 79.8 /100 | #150 | Good 11.0% |
| New Zealanders | 79.3 /100 | #151 | Good 11.0% |
| Ukrainians | 78.0 /100 | #152 | Good 11.0% |
| Immigrants | England | 77.4 /100 | #153 | Good 11.0% |
| Immigrants | Canada | 76.7 /100 | #154 | Good 11.0% |
| Moroccans | 76.4 /100 | #155 | Good 11.0% |
| Immigrants | Sierra Leone | 76.2 /100 | #156 | Good 11.0% |
| Guyanese | 75.1 /100 | #157 | Good 11.0% |
| Immigrants | North America | 74.9 /100 | #158 | Good 11.0% |
| Serbians | 73.6 /100 | #159 | Good 11.0% |
| Croatians | 73.1 /100 | #160 | Good 11.0% |
| Immigrants | Guyana | 70.1 /100 | #161 | Good 11.1% |