Moroccan vs Immigrants from Guyana Disability Age 65 to 74
COMPARE
Moroccan
Immigrants from Guyana
Disability Age 65 to 74
Disability Age 65 to 74 Comparison
Moroccans
Immigrants from Guyana
23.3%
DISABILITY AGE 65 TO 74
54.2/ 100
METRIC RATING
170th/ 347
METRIC RANK
23.6%
DISABILITY AGE 65 TO 74
31.2/ 100
METRIC RATING
190th/ 347
METRIC RANK
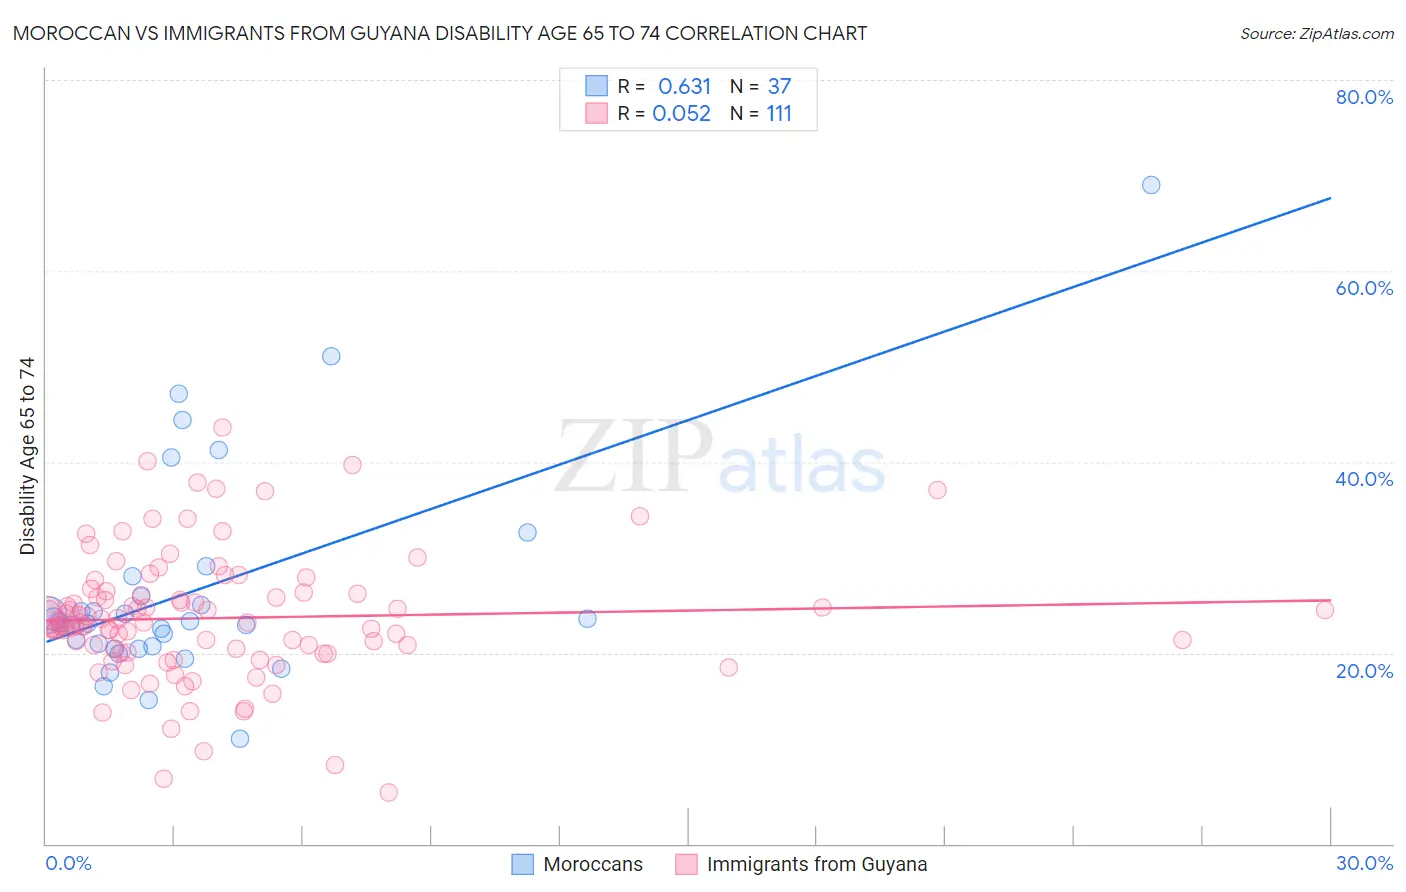
Moroccan vs Immigrants from Guyana Disability Age 65 to 74 Correlation Chart
The statistical analysis conducted on geographies consisting of 201,651,001 people shows a significant positive correlation between the proportion of Moroccans and percentage of population with a disability between the ages 65 and 75 in the United States with a correlation coefficient (R) of 0.631 and weighted average of 23.3%. Similarly, the statistical analysis conducted on geographies consisting of 183,512,147 people shows a slight positive correlation between the proportion of Immigrants from Guyana and percentage of population with a disability between the ages 65 and 75 in the United States with a correlation coefficient (R) of 0.052 and weighted average of 23.6%, a difference of 1.4%.
Disability Age 65 to 74 Correlation Summary
| Measurement | Moroccan | Immigrants from Guyana |
| Minimum | 11.0% | 5.4% |
| Maximum | 69.0% | 43.6% |
| Range | 58.0% | 38.2% |
| Mean | 26.6% | 23.6% |
| Median | 23.2% | 23.1% |
| Interquartile 25% (IQ1) | 20.6% | 20.0% |
| Interquartile 75% (IQ3) | 27.0% | 26.2% |
| Interquartile Range (IQR) | 6.4% | 6.2% |
| Standard Deviation (Sample) | 11.4% | 6.7% |
| Standard Deviation (Population) | 11.2% | 6.6% |
Demographics Similar to Moroccans and Immigrants from Guyana by Disability Age 65 to 74
In terms of disability age 65 to 74, the demographic groups most similar to Moroccans are Cuban (23.3%, a difference of 0.13%), German (23.3%, a difference of 0.22%), Yugoslavian (23.3%, a difference of 0.23%), Immigrants from South Eastern Asia (23.3%, a difference of 0.24%), and Dutch (23.3%, a difference of 0.28%). Similarly, the demographic groups most similar to Immigrants from Guyana are Scottish (23.6%, a difference of 0.12%), Immigrants from Cuba (23.6%, a difference of 0.18%), Portuguese (23.5%, a difference of 0.42%), Basque (23.5%, a difference of 0.46%), and Haitian (23.4%, a difference of 0.70%).
| Demographics | Rating | Rank | Disability Age 65 to 74 |
| Moroccans | 54.2 /100 | #170 | Average 23.3% |
| Cubans | 51.9 /100 | #171 | Average 23.3% |
| Germans | 50.5 /100 | #172 | Average 23.3% |
| Yugoslavians | 50.2 /100 | #173 | Average 23.3% |
| Immigrants | South Eastern Asia | 50.0 /100 | #174 | Average 23.3% |
| Dutch | 49.4 /100 | #175 | Average 23.3% |
| Immigrants | Eritrea | 47.5 /100 | #176 | Average 23.4% |
| Immigrants | Haiti | 47.5 /100 | #177 | Average 23.4% |
| Guyanese | 45.8 /100 | #178 | Average 23.4% |
| Immigrants | Sierra Leone | 45.8 /100 | #179 | Average 23.4% |
| Scandinavians | 45.6 /100 | #180 | Average 23.4% |
| Assyrians/Chaldeans/Syriacs | 45.3 /100 | #181 | Average 23.4% |
| Irish | 44.4 /100 | #182 | Average 23.4% |
| Immigrants | Eastern Africa | 42.8 /100 | #183 | Average 23.4% |
| Immigrants | Germany | 42.5 /100 | #184 | Average 23.4% |
| Haitians | 42.4 /100 | #185 | Average 23.4% |
| Basques | 38.4 /100 | #186 | Fair 23.5% |
| Portuguese | 37.8 /100 | #187 | Fair 23.5% |
| Immigrants | Cuba | 34.0 /100 | #188 | Fair 23.6% |
| Scottish | 33.1 /100 | #189 | Fair 23.6% |
| Immigrants | Guyana | 31.2 /100 | #190 | Fair 23.6% |