Trinidadian and Tobagonian vs Immigrants from Central America Hearing Disability
COMPARE
Trinidadian and Tobagonian
Immigrants from Central America
Hearing Disability
Hearing Disability Comparison
Trinidadians and Tobagonians
Immigrants from Central America
2.5%
HEARING DISABILITY
99.9/ 100
METRIC RATING
12th/ 347
METRIC RANK
3.0%
HEARING DISABILITY
64.9/ 100
METRIC RATING
163rd/ 347
METRIC RANK
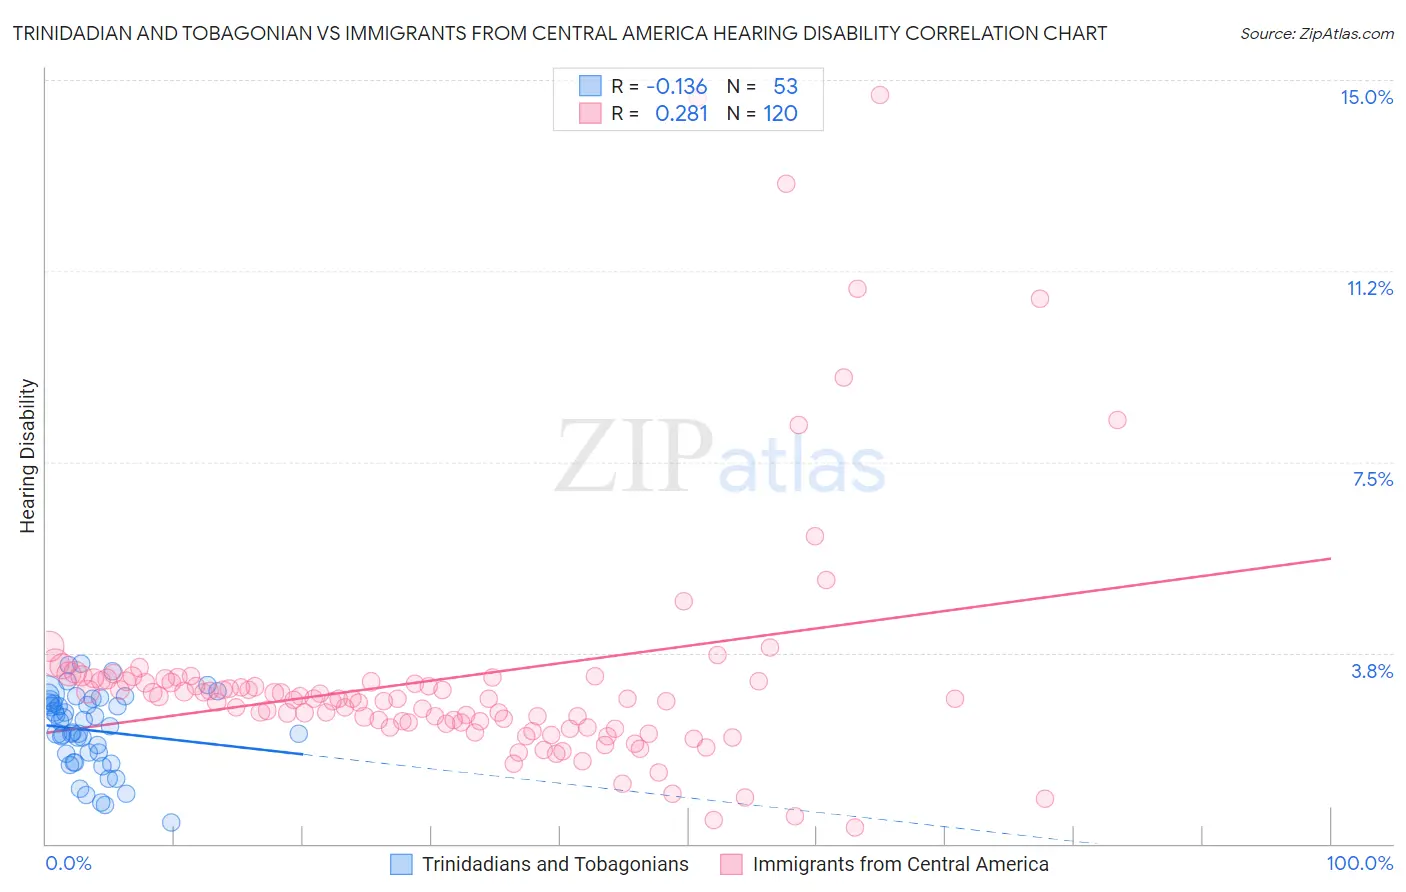
Trinidadian and Tobagonian vs Immigrants from Central America Hearing Disability Correlation Chart
The statistical analysis conducted on geographies consisting of 219,769,787 people shows a poor negative correlation between the proportion of Trinidadians and Tobagonians and percentage of population with hearing disability in the United States with a correlation coefficient (R) of -0.136 and weighted average of 2.5%. Similarly, the statistical analysis conducted on geographies consisting of 535,995,824 people shows a weak positive correlation between the proportion of Immigrants from Central America and percentage of population with hearing disability in the United States with a correlation coefficient (R) of 0.281 and weighted average of 3.0%, a difference of 18.3%.
Hearing Disability Correlation Summary
| Measurement | Trinidadian and Tobagonian | Immigrants from Central America |
| Minimum | 0.42% | 0.32% |
| Maximum | 3.5% | 14.7% |
| Range | 3.1% | 14.4% |
| Mean | 2.2% | 3.2% |
| Median | 2.3% | 2.8% |
| Interquartile 25% (IQ1) | 1.7% | 2.3% |
| Interquartile 75% (IQ3) | 2.8% | 3.2% |
| Interquartile Range (IQR) | 1.1% | 0.87% |
| Standard Deviation (Sample) | 0.74% | 2.4% |
| Standard Deviation (Population) | 0.74% | 2.4% |
Similar Demographics by Hearing Disability
Demographics Similar to Trinidadians and Tobagonians by Hearing Disability
In terms of hearing disability, the demographic groups most similar to Trinidadians and Tobagonians are Sierra Leonean (2.5%, a difference of 0.22%), Immigrants from Trinidad and Tobago (2.5%, a difference of 0.30%), Ecuadorian (2.5%, a difference of 0.54%), Barbadian (2.5%, a difference of 0.85%), and Immigrants from Ecuador (2.5%, a difference of 0.86%).
| Demographics | Rating | Rank | Hearing Disability |
| Immigrants | Barbados | 100.0 /100 | #5 | Exceptional 2.4% |
| Vietnamese | 100.0 /100 | #6 | Exceptional 2.4% |
| Immigrants | Bangladesh | 100.0 /100 | #7 | Exceptional 2.4% |
| British West Indians | 100.0 /100 | #8 | Exceptional 2.4% |
| Immigrants | Dominican Republic | 100.0 /100 | #9 | Exceptional 2.4% |
| Immigrants | Ecuador | 99.9 /100 | #10 | Exceptional 2.5% |
| Immigrants | Trinidad and Tobago | 99.9 /100 | #11 | Exceptional 2.5% |
| Trinidadians and Tobagonians | 99.9 /100 | #12 | Exceptional 2.5% |
| Sierra Leoneans | 99.9 /100 | #13 | Exceptional 2.5% |
| Ecuadorians | 99.9 /100 | #14 | Exceptional 2.5% |
| Barbadians | 99.9 /100 | #15 | Exceptional 2.5% |
| Immigrants | West Indies | 99.9 /100 | #16 | Exceptional 2.5% |
| Immigrants | India | 99.9 /100 | #17 | Exceptional 2.5% |
| Dominicans | 99.8 /100 | #18 | Exceptional 2.5% |
| Thais | 99.8 /100 | #19 | Exceptional 2.5% |
Demographics Similar to Immigrants from Central America by Hearing Disability
In terms of hearing disability, the demographic groups most similar to Immigrants from Central America are Immigrants from Cambodia (3.0%, a difference of 0.020%), Immigrants from Zimbabwe (3.0%, a difference of 0.080%), Immigrants from Japan (2.9%, a difference of 0.15%), Albanian (2.9%, a difference of 0.17%), and Immigrants from South Eastern Asia (3.0%, a difference of 0.21%).
| Demographics | Rating | Rank | Hearing Disability |
| Immigrants | Poland | 70.2 /100 | #156 | Good 2.9% |
| Immigrants | Kazakhstan | 69.6 /100 | #157 | Good 2.9% |
| Immigrants | Burma/Myanmar | 69.5 /100 | #158 | Good 2.9% |
| Immigrants | Australia | 67.4 /100 | #159 | Good 2.9% |
| Immigrants | Fiji | 67.1 /100 | #160 | Good 2.9% |
| Albanians | 66.6 /100 | #161 | Good 2.9% |
| Immigrants | Japan | 66.3 /100 | #162 | Good 2.9% |
| Immigrants | Central America | 64.9 /100 | #163 | Good 3.0% |
| Immigrants | Cambodia | 64.8 /100 | #164 | Good 3.0% |
| Immigrants | Zimbabwe | 64.2 /100 | #165 | Good 3.0% |
| Immigrants | South Eastern Asia | 62.9 /100 | #166 | Good 3.0% |
| Immigrants | Eastern Europe | 58.1 /100 | #167 | Average 3.0% |
| Immigrants | Greece | 57.9 /100 | #168 | Average 3.0% |
| Arabs | 57.6 /100 | #169 | Average 3.0% |
| Immigrants | Cabo Verde | 56.9 /100 | #170 | Average 3.0% |