Trinidadian and Tobagonian vs Yaqui Hearing Disability
COMPARE
Trinidadian and Tobagonian
Yaqui
Hearing Disability
Hearing Disability Comparison
Trinidadians and Tobagonians
Yaqui
2.5%
HEARING DISABILITY
99.9/ 100
METRIC RATING
12th/ 347
METRIC RANK
3.4%
HEARING DISABILITY
0.2/ 100
METRIC RATING
257th/ 347
METRIC RANK
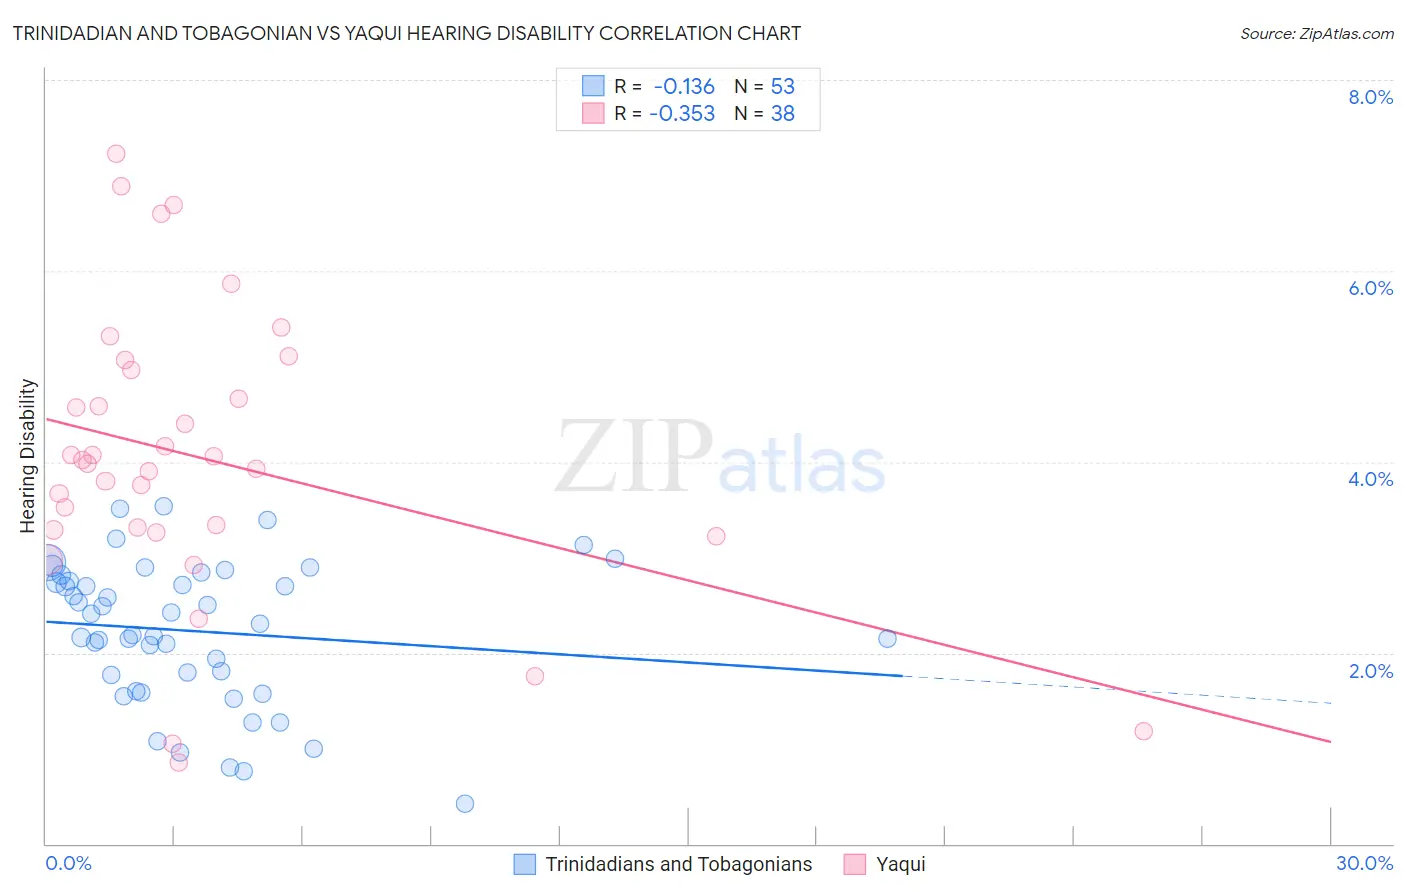
Trinidadian and Tobagonian vs Yaqui Hearing Disability Correlation Chart
The statistical analysis conducted on geographies consisting of 219,769,787 people shows a poor negative correlation between the proportion of Trinidadians and Tobagonians and percentage of population with hearing disability in the United States with a correlation coefficient (R) of -0.136 and weighted average of 2.5%. Similarly, the statistical analysis conducted on geographies consisting of 107,718,352 people shows a mild negative correlation between the proportion of Yaqui and percentage of population with hearing disability in the United States with a correlation coefficient (R) of -0.353 and weighted average of 3.4%, a difference of 38.1%.
Hearing Disability Correlation Summary
| Measurement | Trinidadian and Tobagonian | Yaqui |
| Minimum | 0.42% | 0.85% |
| Maximum | 3.5% | 7.2% |
| Range | 3.1% | 6.4% |
| Mean | 2.2% | 4.0% |
| Median | 2.3% | 4.0% |
| Interquartile 25% (IQ1) | 1.7% | 3.3% |
| Interquartile 75% (IQ3) | 2.8% | 5.0% |
| Interquartile Range (IQR) | 1.1% | 1.7% |
| Standard Deviation (Sample) | 0.74% | 1.5% |
| Standard Deviation (Population) | 0.74% | 1.5% |
Similar Demographics by Hearing Disability
Demographics Similar to Trinidadians and Tobagonians by Hearing Disability
In terms of hearing disability, the demographic groups most similar to Trinidadians and Tobagonians are Sierra Leonean (2.5%, a difference of 0.22%), Immigrants from Trinidad and Tobago (2.5%, a difference of 0.30%), Ecuadorian (2.5%, a difference of 0.54%), Barbadian (2.5%, a difference of 0.85%), and Immigrants from Ecuador (2.5%, a difference of 0.86%).
| Demographics | Rating | Rank | Hearing Disability |
| Immigrants | Barbados | 100.0 /100 | #5 | Exceptional 2.4% |
| Vietnamese | 100.0 /100 | #6 | Exceptional 2.4% |
| Immigrants | Bangladesh | 100.0 /100 | #7 | Exceptional 2.4% |
| British West Indians | 100.0 /100 | #8 | Exceptional 2.4% |
| Immigrants | Dominican Republic | 100.0 /100 | #9 | Exceptional 2.4% |
| Immigrants | Ecuador | 99.9 /100 | #10 | Exceptional 2.5% |
| Immigrants | Trinidad and Tobago | 99.9 /100 | #11 | Exceptional 2.5% |
| Trinidadians and Tobagonians | 99.9 /100 | #12 | Exceptional 2.5% |
| Sierra Leoneans | 99.9 /100 | #13 | Exceptional 2.5% |
| Ecuadorians | 99.9 /100 | #14 | Exceptional 2.5% |
| Barbadians | 99.9 /100 | #15 | Exceptional 2.5% |
| Immigrants | West Indies | 99.9 /100 | #16 | Exceptional 2.5% |
| Immigrants | India | 99.9 /100 | #17 | Exceptional 2.5% |
| Dominicans | 99.8 /100 | #18 | Exceptional 2.5% |
| Thais | 99.8 /100 | #19 | Exceptional 2.5% |
Demographics Similar to Yaqui by Hearing Disability
In terms of hearing disability, the demographic groups most similar to Yaqui are Northern European (3.4%, a difference of 0.070%), Slovene (3.5%, a difference of 0.30%), Portuguese (3.5%, a difference of 0.38%), Hawaiian (3.5%, a difference of 0.42%), and Hmong (3.4%, a difference of 0.45%).
| Demographics | Rating | Rank | Hearing Disability |
| Yuman | 0.4 /100 | #250 | Tragic 3.4% |
| Hungarians | 0.4 /100 | #251 | Tragic 3.4% |
| Croatians | 0.4 /100 | #252 | Tragic 3.4% |
| Carpatho Rusyns | 0.3 /100 | #253 | Tragic 3.4% |
| Slavs | 0.2 /100 | #254 | Tragic 3.4% |
| Poles | 0.2 /100 | #255 | Tragic 3.4% |
| Hmong | 0.2 /100 | #256 | Tragic 3.4% |
| Yaqui | 0.2 /100 | #257 | Tragic 3.4% |
| Northern Europeans | 0.2 /100 | #258 | Tragic 3.4% |
| Slovenes | 0.1 /100 | #259 | Tragic 3.5% |
| Portuguese | 0.1 /100 | #260 | Tragic 3.5% |
| Hawaiians | 0.1 /100 | #261 | Tragic 3.5% |
| Immigrants | North America | 0.1 /100 | #262 | Tragic 3.5% |
| Immigrants | Canada | 0.1 /100 | #263 | Tragic 3.5% |
| Immigrants | Germany | 0.1 /100 | #264 | Tragic 3.5% |