Trinidadian and Tobagonian vs Immigrants from Guatemala Hearing Disability
COMPARE
Trinidadian and Tobagonian
Immigrants from Guatemala
Hearing Disability
Hearing Disability Comparison
Trinidadians and Tobagonians
Immigrants from Guatemala
2.5%
HEARING DISABILITY
99.9/ 100
METRIC RATING
12th/ 347
METRIC RANK
2.8%
HEARING DISABILITY
95.1/ 100
METRIC RATING
99th/ 347
METRIC RANK
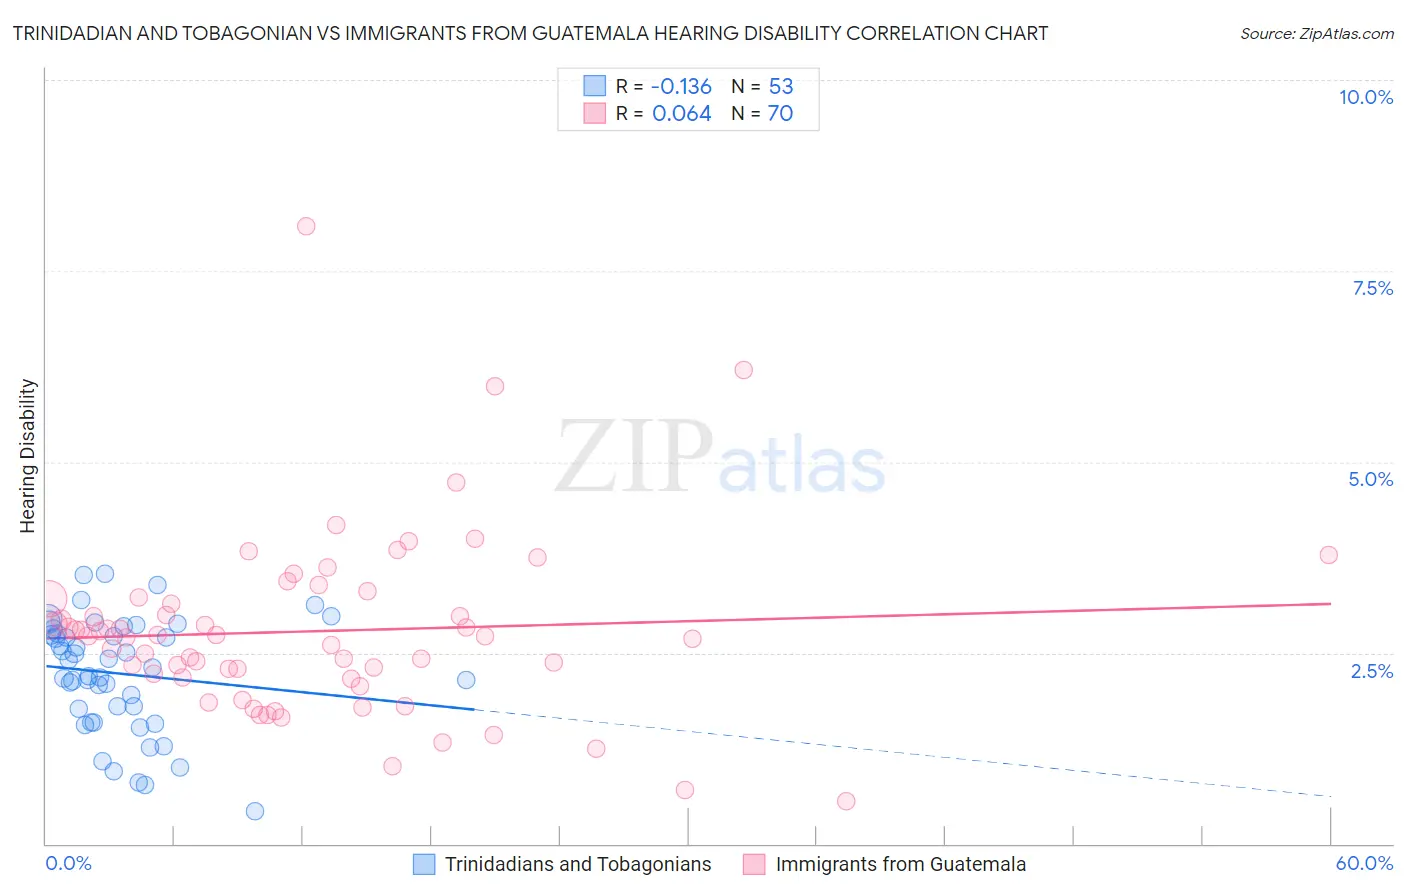
Trinidadian and Tobagonian vs Immigrants from Guatemala Hearing Disability Correlation Chart
The statistical analysis conducted on geographies consisting of 219,769,787 people shows a poor negative correlation between the proportion of Trinidadians and Tobagonians and percentage of population with hearing disability in the United States with a correlation coefficient (R) of -0.136 and weighted average of 2.5%. Similarly, the statistical analysis conducted on geographies consisting of 377,187,532 people shows a slight positive correlation between the proportion of Immigrants from Guatemala and percentage of population with hearing disability in the United States with a correlation coefficient (R) of 0.064 and weighted average of 2.8%, a difference of 11.7%.
Hearing Disability Correlation Summary
| Measurement | Trinidadian and Tobagonian | Immigrants from Guatemala |
| Minimum | 0.42% | 0.55% |
| Maximum | 3.5% | 8.1% |
| Range | 3.1% | 7.5% |
| Mean | 2.2% | 2.8% |
| Median | 2.3% | 2.7% |
| Interquartile 25% (IQ1) | 1.7% | 2.2% |
| Interquartile 75% (IQ3) | 2.8% | 3.2% |
| Interquartile Range (IQR) | 1.1% | 1.0% |
| Standard Deviation (Sample) | 0.74% | 1.2% |
| Standard Deviation (Population) | 0.74% | 1.2% |
Similar Demographics by Hearing Disability
Demographics Similar to Trinidadians and Tobagonians by Hearing Disability
In terms of hearing disability, the demographic groups most similar to Trinidadians and Tobagonians are Sierra Leonean (2.5%, a difference of 0.22%), Immigrants from Trinidad and Tobago (2.5%, a difference of 0.30%), Ecuadorian (2.5%, a difference of 0.54%), Barbadian (2.5%, a difference of 0.85%), and Immigrants from Ecuador (2.5%, a difference of 0.86%).
| Demographics | Rating | Rank | Hearing Disability |
| Immigrants | Barbados | 100.0 /100 | #5 | Exceptional 2.4% |
| Vietnamese | 100.0 /100 | #6 | Exceptional 2.4% |
| Immigrants | Bangladesh | 100.0 /100 | #7 | Exceptional 2.4% |
| British West Indians | 100.0 /100 | #8 | Exceptional 2.4% |
| Immigrants | Dominican Republic | 100.0 /100 | #9 | Exceptional 2.4% |
| Immigrants | Ecuador | 99.9 /100 | #10 | Exceptional 2.5% |
| Immigrants | Trinidad and Tobago | 99.9 /100 | #11 | Exceptional 2.5% |
| Trinidadians and Tobagonians | 99.9 /100 | #12 | Exceptional 2.5% |
| Sierra Leoneans | 99.9 /100 | #13 | Exceptional 2.5% |
| Ecuadorians | 99.9 /100 | #14 | Exceptional 2.5% |
| Barbadians | 99.9 /100 | #15 | Exceptional 2.5% |
| Immigrants | West Indies | 99.9 /100 | #16 | Exceptional 2.5% |
| Immigrants | India | 99.9 /100 | #17 | Exceptional 2.5% |
| Dominicans | 99.8 /100 | #18 | Exceptional 2.5% |
| Thais | 99.8 /100 | #19 | Exceptional 2.5% |
Demographics Similar to Immigrants from Guatemala by Hearing Disability
In terms of hearing disability, the demographic groups most similar to Immigrants from Guatemala are Immigrants from Honduras (2.8%, a difference of 0.040%), Immigrants from Eastern Africa (2.8%, a difference of 0.050%), Immigrants from Afghanistan (2.8%, a difference of 0.10%), Immigrants from Spain (2.8%, a difference of 0.11%), and Taiwanese (2.8%, a difference of 0.12%).
| Demographics | Rating | Rank | Hearing Disability |
| Iranians | 96.4 /100 | #92 | Exceptional 2.8% |
| Immigrants | Kuwait | 96.3 /100 | #93 | Exceptional 2.8% |
| Uruguayans | 95.9 /100 | #94 | Exceptional 2.8% |
| Israelis | 95.9 /100 | #95 | Exceptional 2.8% |
| Immigrants | Somalia | 95.5 /100 | #96 | Exceptional 2.8% |
| Immigrants | Afghanistan | 95.3 /100 | #97 | Exceptional 2.8% |
| Immigrants | Honduras | 95.1 /100 | #98 | Exceptional 2.8% |
| Immigrants | Guatemala | 95.1 /100 | #99 | Exceptional 2.8% |
| Immigrants | Eastern Africa | 95.0 /100 | #100 | Exceptional 2.8% |
| Immigrants | Spain | 94.9 /100 | #101 | Exceptional 2.8% |
| Taiwanese | 94.8 /100 | #102 | Exceptional 2.8% |
| Immigrants | Indonesia | 94.7 /100 | #103 | Exceptional 2.8% |
| Burmese | 94.2 /100 | #104 | Exceptional 2.8% |
| Moroccans | 93.9 /100 | #105 | Exceptional 2.8% |
| Hondurans | 93.4 /100 | #106 | Exceptional 2.8% |