Tongan vs African Vision Disability
COMPARE
Tongan
African
Vision Disability
Vision Disability Comparison
Tongans
Africans
2.0%
VISION DISABILITY
99.5/ 100
METRIC RATING
51st/ 347
METRIC RANK
2.5%
VISION DISABILITY
0.0/ 100
METRIC RATING
300th/ 347
METRIC RANK
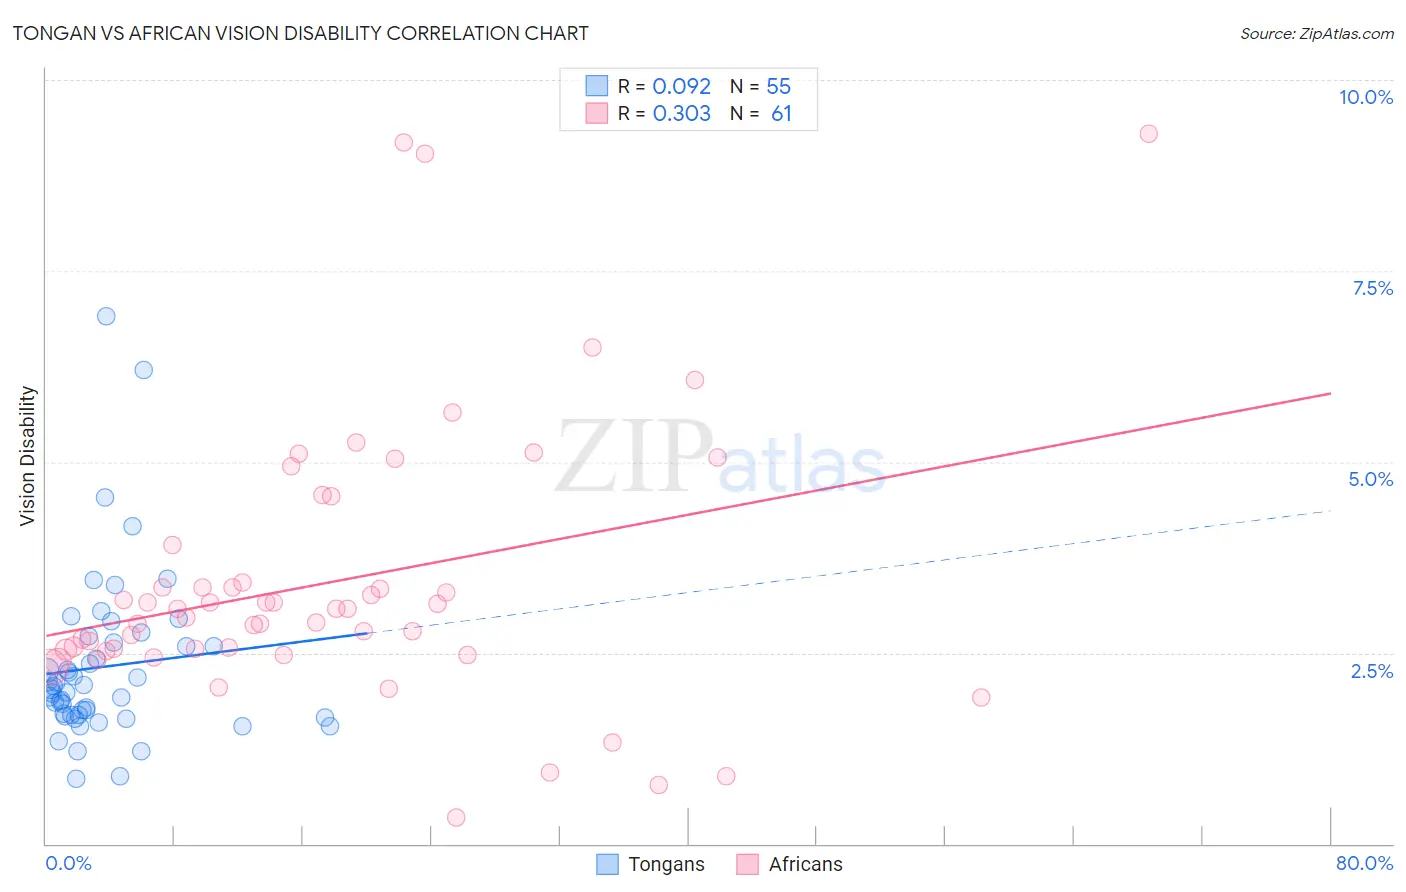
Tongan vs African Vision Disability Correlation Chart
The statistical analysis conducted on geographies consisting of 102,891,232 people shows a slight positive correlation between the proportion of Tongans and percentage of population with vision disability in the United States with a correlation coefficient (R) of 0.092 and weighted average of 2.0%. Similarly, the statistical analysis conducted on geographies consisting of 469,580,037 people shows a mild positive correlation between the proportion of Africans and percentage of population with vision disability in the United States with a correlation coefficient (R) of 0.303 and weighted average of 2.5%, a difference of 27.8%.
Vision Disability Correlation Summary
| Measurement | Tongan | African |
| Minimum | 0.85% | 0.34% |
| Maximum | 6.9% | 9.3% |
| Range | 6.1% | 9.0% |
| Mean | 2.3% | 3.4% |
| Median | 2.0% | 3.1% |
| Interquartile 25% (IQ1) | 1.7% | 2.5% |
| Interquartile 75% (IQ3) | 2.6% | 3.7% |
| Interquartile Range (IQR) | 0.96% | 1.1% |
| Standard Deviation (Sample) | 1.1% | 1.8% |
| Standard Deviation (Population) | 1.1% | 1.8% |
Similar Demographics by Vision Disability
Demographics Similar to Tongans by Vision Disability
In terms of vision disability, the demographic groups most similar to Tongans are Afghan (2.0%, a difference of 0.090%), Latvian (2.0%, a difference of 0.15%), Israeli (2.0%, a difference of 0.22%), Immigrants from Serbia (2.0%, a difference of 0.31%), and Immigrants from Belarus (2.0%, a difference of 0.42%).
| Demographics | Rating | Rank | Vision Disability |
| Immigrants | Indonesia | 99.7 /100 | #44 | Exceptional 2.0% |
| Ethiopians | 99.7 /100 | #45 | Exceptional 2.0% |
| Immigrants | Sweden | 99.7 /100 | #46 | Exceptional 2.0% |
| Immigrants | Bulgaria | 99.7 /100 | #47 | Exceptional 2.0% |
| Israelis | 99.6 /100 | #48 | Exceptional 2.0% |
| Latvians | 99.5 /100 | #49 | Exceptional 2.0% |
| Afghans | 99.5 /100 | #50 | Exceptional 2.0% |
| Tongans | 99.5 /100 | #51 | Exceptional 2.0% |
| Immigrants | Serbia | 99.4 /100 | #52 | Exceptional 2.0% |
| Immigrants | Belarus | 99.3 /100 | #53 | Exceptional 2.0% |
| Macedonians | 99.3 /100 | #54 | Exceptional 2.0% |
| Laotians | 99.3 /100 | #55 | Exceptional 2.0% |
| Jordanians | 99.2 /100 | #56 | Exceptional 2.0% |
| Somalis | 99.2 /100 | #57 | Exceptional 2.0% |
| Immigrants | Saudi Arabia | 99.2 /100 | #58 | Exceptional 2.0% |
Demographics Similar to Africans by Vision Disability
In terms of vision disability, the demographic groups most similar to Africans are Menominee (2.5%, a difference of 0.18%), Cree (2.5%, a difference of 0.20%), Mexican (2.5%, a difference of 0.24%), Immigrants from Dominica (2.5%, a difference of 0.37%), and Immigrants from Mexico (2.5%, a difference of 1.1%).
| Demographics | Rating | Rank | Vision Disability |
| Yaqui | 0.0 /100 | #293 | Tragic 2.5% |
| Ottawa | 0.0 /100 | #294 | Tragic 2.5% |
| Delaware | 0.0 /100 | #295 | Tragic 2.5% |
| Immigrants | Mexico | 0.0 /100 | #296 | Tragic 2.5% |
| Immigrants | Dominica | 0.0 /100 | #297 | Tragic 2.5% |
| Mexicans | 0.0 /100 | #298 | Tragic 2.5% |
| Cree | 0.0 /100 | #299 | Tragic 2.5% |
| Africans | 0.0 /100 | #300 | Tragic 2.5% |
| Menominee | 0.0 /100 | #301 | Tragic 2.5% |
| Spanish American Indians | 0.0 /100 | #302 | Tragic 2.6% |
| Immigrants | Cabo Verde | 0.0 /100 | #303 | Tragic 2.6% |
| Aleuts | 0.0 /100 | #304 | Tragic 2.6% |
| Hispanics or Latinos | 0.0 /100 | #305 | Tragic 2.6% |
| Iroquois | 0.0 /100 | #306 | Tragic 2.6% |
| Immigrants | Dominican Republic | 0.0 /100 | #307 | Tragic 2.6% |