Tongan vs Immigrants from Oceania Unemployment Among Ages 20 to 24 years
COMPARE
Tongan
Immigrants from Oceania
Unemployment Among Ages 20 to 24 years
Unemployment Among Ages 20 to 24 years Comparison
Tongans
Immigrants from Oceania
9.4%
UNEMPLOYMENT AMONG AGES 20 TO 24 YEARS
100.0/ 100
METRIC RATING
22nd/ 347
METRIC RANK
10.0%
UNEMPLOYMENT AMONG AGES 20 TO 24 YEARS
97.4/ 100
METRIC RATING
87th/ 347
METRIC RANK
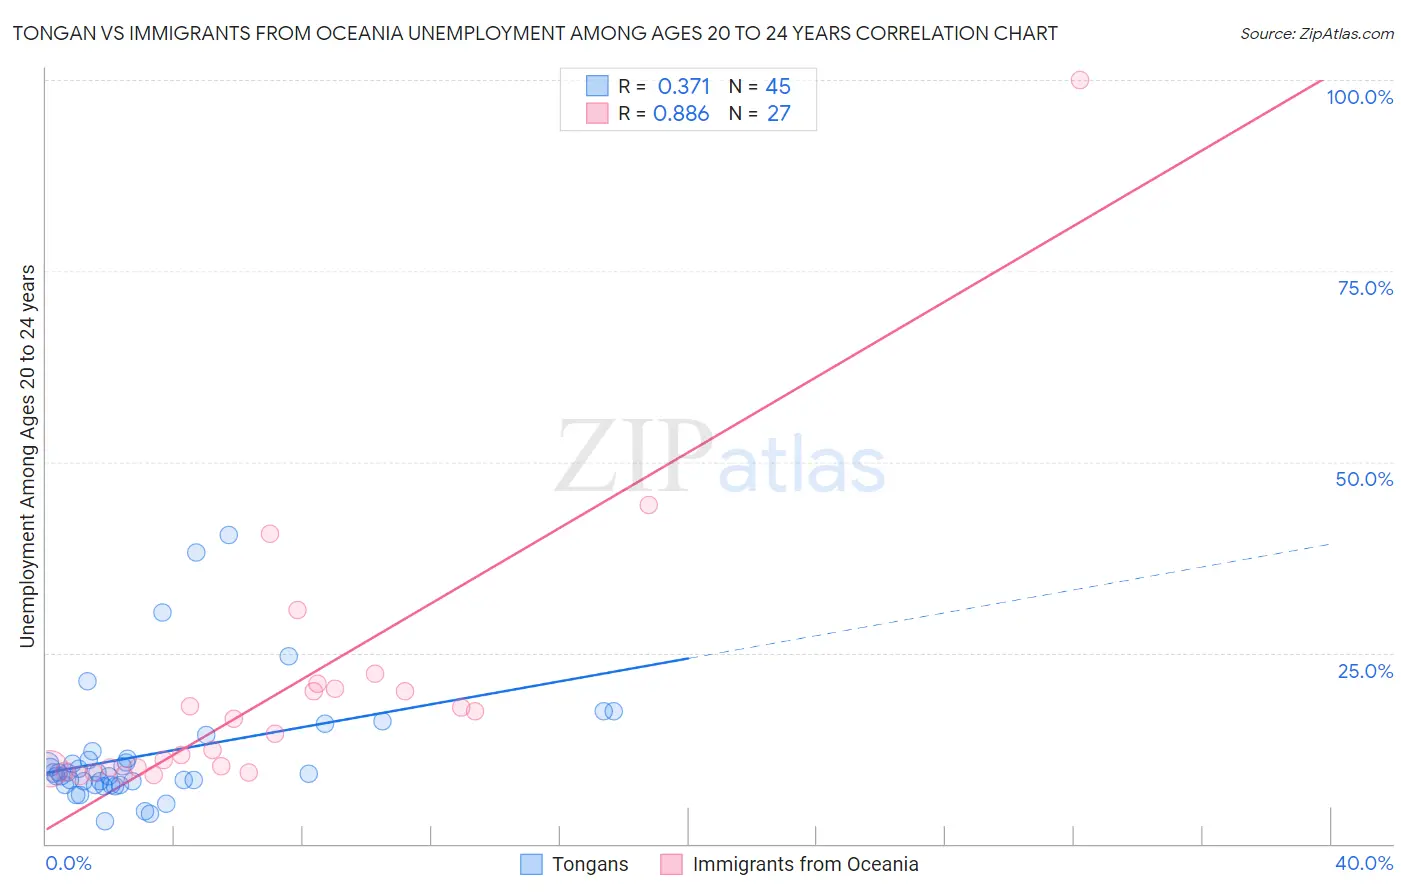
Tongan vs Immigrants from Oceania Unemployment Among Ages 20 to 24 years Correlation Chart
The statistical analysis conducted on geographies consisting of 101,940,132 people shows a mild positive correlation between the proportion of Tongans and unemployment rate among population between the ages 20 and 24 in the United States with a correlation coefficient (R) of 0.371 and weighted average of 9.4%. Similarly, the statistical analysis conducted on geographies consisting of 298,383,389 people shows a very strong positive correlation between the proportion of Immigrants from Oceania and unemployment rate among population between the ages 20 and 24 in the United States with a correlation coefficient (R) of 0.886 and weighted average of 10.0%, a difference of 5.9%.
Unemployment Among Ages 20 to 24 years Correlation Summary
| Measurement | Tongan | Immigrants from Oceania |
| Minimum | 3.0% | 9.0% |
| Maximum | 40.4% | 100.0% |
| Range | 37.4% | 91.0% |
| Mean | 11.7% | 19.7% |
| Median | 9.3% | 14.4% |
| Interquartile 25% (IQ1) | 7.7% | 9.8% |
| Interquartile 75% (IQ3) | 11.6% | 20.3% |
| Interquartile Range (IQR) | 3.8% | 10.5% |
| Standard Deviation (Sample) | 7.9% | 18.5% |
| Standard Deviation (Population) | 7.8% | 18.2% |
Similar Demographics by Unemployment Among Ages 20 to 24 years
Demographics Similar to Tongans by Unemployment Among Ages 20 to 24 years
In terms of unemployment among ages 20 to 24 years, the demographic groups most similar to Tongans are Immigrants from Nepal (9.4%, a difference of 0.0%), Immigrants from Bosnia and Herzegovina (9.4%, a difference of 0.27%), Hmong (9.4%, a difference of 0.28%), Osage (9.4%, a difference of 0.28%), and Taiwanese (9.4%, a difference of 0.31%).
| Demographics | Rating | Rank | Unemployment Among Ages 20 to 24 years |
| Immigrants | Sudan | 100.0 /100 | #15 | Exceptional 9.3% |
| Danes | 100.0 /100 | #16 | Exceptional 9.3% |
| Czechs | 100.0 /100 | #17 | Exceptional 9.3% |
| Chinese | 100.0 /100 | #18 | Exceptional 9.4% |
| Hmong | 100.0 /100 | #19 | Exceptional 9.4% |
| Osage | 100.0 /100 | #20 | Exceptional 9.4% |
| Immigrants | Bosnia and Herzegovina | 100.0 /100 | #21 | Exceptional 9.4% |
| Tongans | 100.0 /100 | #22 | Exceptional 9.4% |
| Immigrants | Nepal | 100.0 /100 | #23 | Exceptional 9.4% |
| Taiwanese | 100.0 /100 | #24 | Exceptional 9.4% |
| Immigrants | Eritrea | 100.0 /100 | #25 | Exceptional 9.5% |
| Swedes | 100.0 /100 | #26 | Exceptional 9.5% |
| Immigrants | Zimbabwe | 100.0 /100 | #27 | Exceptional 9.5% |
| Immigrants | Afghanistan | 100.0 /100 | #28 | Exceptional 9.5% |
| Immigrants | North Macedonia | 100.0 /100 | #29 | Exceptional 9.5% |
Demographics Similar to Immigrants from Oceania by Unemployment Among Ages 20 to 24 years
In terms of unemployment among ages 20 to 24 years, the demographic groups most similar to Immigrants from Oceania are Immigrants from Vietnam (10.0%, a difference of 0.040%), Polish (10.0%, a difference of 0.090%), Macedonian (10.0%, a difference of 0.11%), Chilean (10.0%, a difference of 0.11%), and Bhutanese (10.0%, a difference of 0.14%).
| Demographics | Rating | Rank | Unemployment Among Ages 20 to 24 years |
| Immigrants | Netherlands | 98.2 /100 | #80 | Exceptional 9.9% |
| Yaqui | 98.0 /100 | #81 | Exceptional 9.9% |
| Sri Lankans | 98.0 /100 | #82 | Exceptional 9.9% |
| Immigrants | Bulgaria | 98.0 /100 | #83 | Exceptional 9.9% |
| Latvians | 97.9 /100 | #84 | Exceptional 9.9% |
| New Zealanders | 97.8 /100 | #85 | Exceptional 9.9% |
| Immigrants | Vietnam | 97.5 /100 | #86 | Exceptional 10.0% |
| Immigrants | Oceania | 97.4 /100 | #87 | Exceptional 10.0% |
| Poles | 97.1 /100 | #88 | Exceptional 10.0% |
| Macedonians | 97.0 /100 | #89 | Exceptional 10.0% |
| Chileans | 97.0 /100 | #90 | Exceptional 10.0% |
| Bhutanese | 96.9 /100 | #91 | Exceptional 10.0% |
| Bangladeshis | 96.9 /100 | #92 | Exceptional 10.0% |
| Immigrants | Malaysia | 96.9 /100 | #93 | Exceptional 10.0% |
| Immigrants | Micronesia | 96.6 /100 | #94 | Exceptional 10.0% |