Tohono O'odham vs Finnish Disability Age 65 to 74
COMPARE
Tohono O'odham
Finnish
Disability Age 65 to 74
Disability Age 65 to 74 Comparison
Tohono O'odham
Finns
36.0%
DISABILITY AGE 65 TO 74
0.0/ 100
METRIC RATING
345th/ 347
METRIC RANK
22.9%
DISABILITY AGE 65 TO 74
76.5/ 100
METRIC RATING
152nd/ 347
METRIC RANK
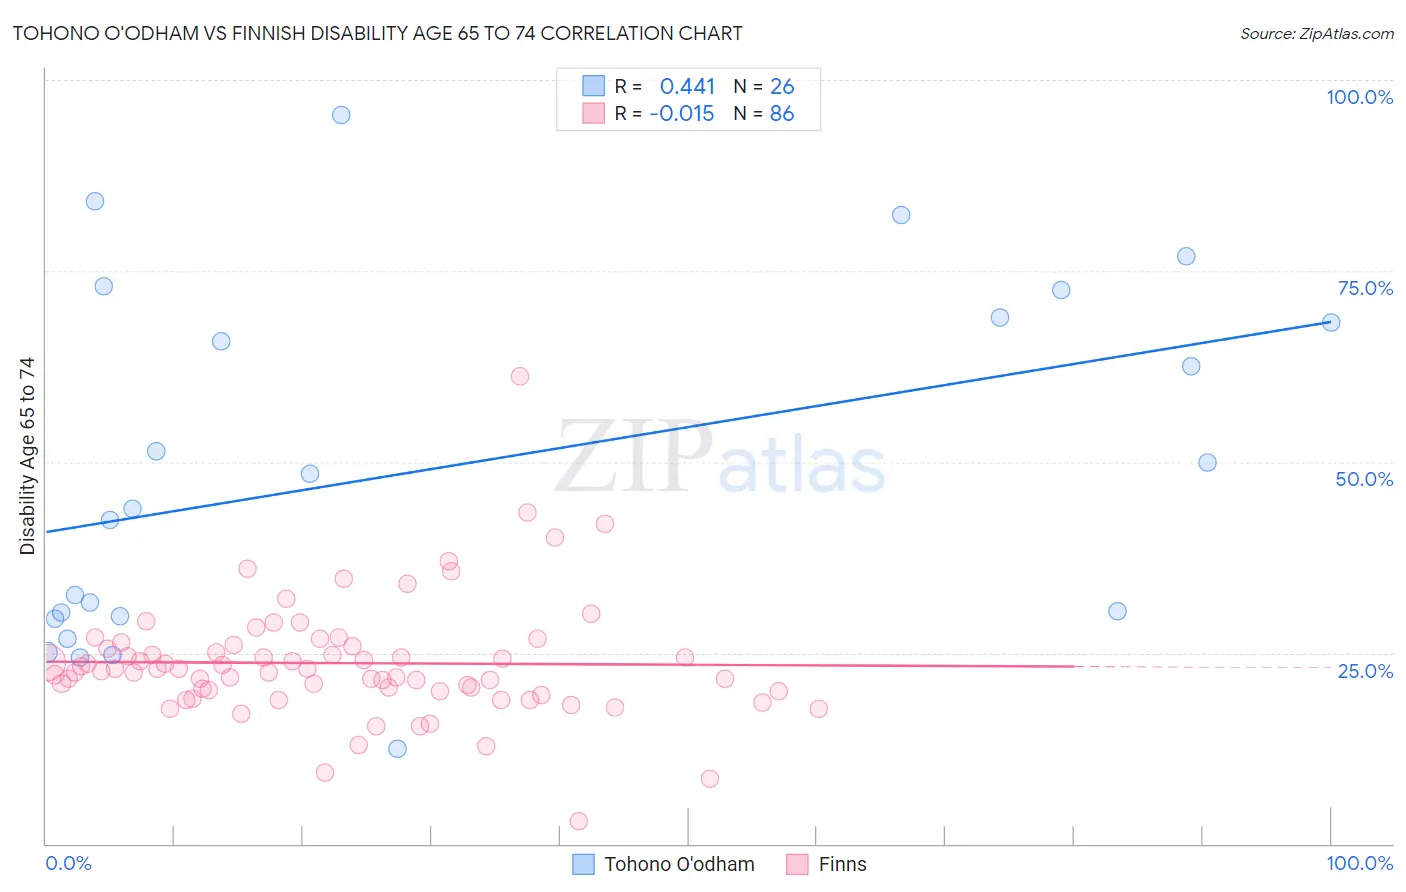
Tohono O'odham vs Finnish Disability Age 65 to 74 Correlation Chart
The statistical analysis conducted on geographies consisting of 58,691,657 people shows a moderate positive correlation between the proportion of Tohono O'odham and percentage of population with a disability between the ages 65 and 75 in the United States with a correlation coefficient (R) of 0.441 and weighted average of 36.0%. Similarly, the statistical analysis conducted on geographies consisting of 404,031,913 people shows no correlation between the proportion of Finns and percentage of population with a disability between the ages 65 and 75 in the United States with a correlation coefficient (R) of -0.015 and weighted average of 22.9%, a difference of 57.1%.
Disability Age 65 to 74 Correlation Summary
| Measurement | Tohono O'odham | Finnish |
| Minimum | 12.4% | 2.9% |
| Maximum | 95.5% | 61.3% |
| Range | 83.1% | 58.3% |
| Mean | 49.4% | 23.7% |
| Median | 46.1% | 22.7% |
| Interquartile 25% (IQ1) | 29.8% | 20.0% |
| Interquartile 75% (IQ3) | 69.0% | 25.9% |
| Interquartile Range (IQR) | 39.1% | 5.9% |
| Standard Deviation (Sample) | 23.1% | 7.8% |
| Standard Deviation (Population) | 22.6% | 7.8% |
Similar Demographics by Disability Age 65 to 74
Demographics Similar to Tohono O'odham by Disability Age 65 to 74
In terms of disability age 65 to 74, the demographic groups most similar to Tohono O'odham are Inupiat (34.5%, a difference of 4.3%), Yup'ik (37.8%, a difference of 5.0%), Pima (38.6%, a difference of 7.1%), Navajo (33.3%, a difference of 8.1%), and Pueblo (33.1%, a difference of 8.9%).
| Demographics | Rating | Rank | Disability Age 65 to 74 |
| Colville | 0.0 /100 | #333 | Tragic 30.5% |
| Alaska Natives | 0.0 /100 | #334 | Tragic 30.6% |
| Cheyenne | 0.0 /100 | #335 | Tragic 31.1% |
| Yuman | 0.0 /100 | #336 | Tragic 31.5% |
| Houma | 0.0 /100 | #337 | Tragic 32.3% |
| Alaskan Athabascans | 0.0 /100 | #338 | Tragic 32.4% |
| Kiowa | 0.0 /100 | #339 | Tragic 32.6% |
| Lumbee | 0.0 /100 | #340 | Tragic 32.7% |
| Tsimshian | 0.0 /100 | #341 | Tragic 32.9% |
| Pueblo | 0.0 /100 | #342 | Tragic 33.1% |
| Navajo | 0.0 /100 | #343 | Tragic 33.3% |
| Inupiat | 0.0 /100 | #344 | Tragic 34.5% |
| Tohono O'odham | 0.0 /100 | #345 | Tragic 36.0% |
| Yup'ik | 0.0 /100 | #346 | Tragic 37.8% |
| Pima | 0.0 /100 | #347 | Tragic 38.6% |
Demographics Similar to Finns by Disability Age 65 to 74
In terms of disability age 65 to 74, the demographic groups most similar to Finns are Canadian (22.9%, a difference of 0.090%), Immigrants from Morocco (22.9%, a difference of 0.090%), Slavic (23.0%, a difference of 0.11%), Sri Lankan (23.0%, a difference of 0.20%), and British (23.0%, a difference of 0.21%).
| Demographics | Rating | Rank | Disability Age 65 to 74 |
| Immigrants | Uganda | 84.0 /100 | #145 | Excellent 22.8% |
| Alsatians | 83.7 /100 | #146 | Excellent 22.8% |
| Immigrants | Uzbekistan | 83.1 /100 | #147 | Excellent 22.8% |
| New Zealanders | 79.9 /100 | #148 | Good 22.9% |
| Swiss | 79.7 /100 | #149 | Good 22.9% |
| Canadians | 77.7 /100 | #150 | Good 22.9% |
| Immigrants | Morocco | 77.6 /100 | #151 | Good 22.9% |
| Finns | 76.5 /100 | #152 | Good 22.9% |
| Slavs | 75.2 /100 | #153 | Good 23.0% |
| Sri Lankans | 74.0 /100 | #154 | Good 23.0% |
| British | 73.9 /100 | #155 | Good 23.0% |
| Immigrants | Western Asia | 73.8 /100 | #156 | Good 23.0% |
| Czechoslovakians | 72.4 /100 | #157 | Good 23.0% |
| Immigrants | Vietnam | 69.1 /100 | #158 | Good 23.1% |
| South American Indians | 65.5 /100 | #159 | Good 23.1% |