Soviet Union vs Finnish Disability Age 65 to 74
COMPARE
Soviet Union
Finnish
Disability Age 65 to 74
Disability Age 65 to 74 Comparison
Soviet Union
Finns
21.0%
DISABILITY AGE 65 TO 74
99.9/ 100
METRIC RATING
24th/ 347
METRIC RANK
22.9%
DISABILITY AGE 65 TO 74
76.5/ 100
METRIC RATING
152nd/ 347
METRIC RANK
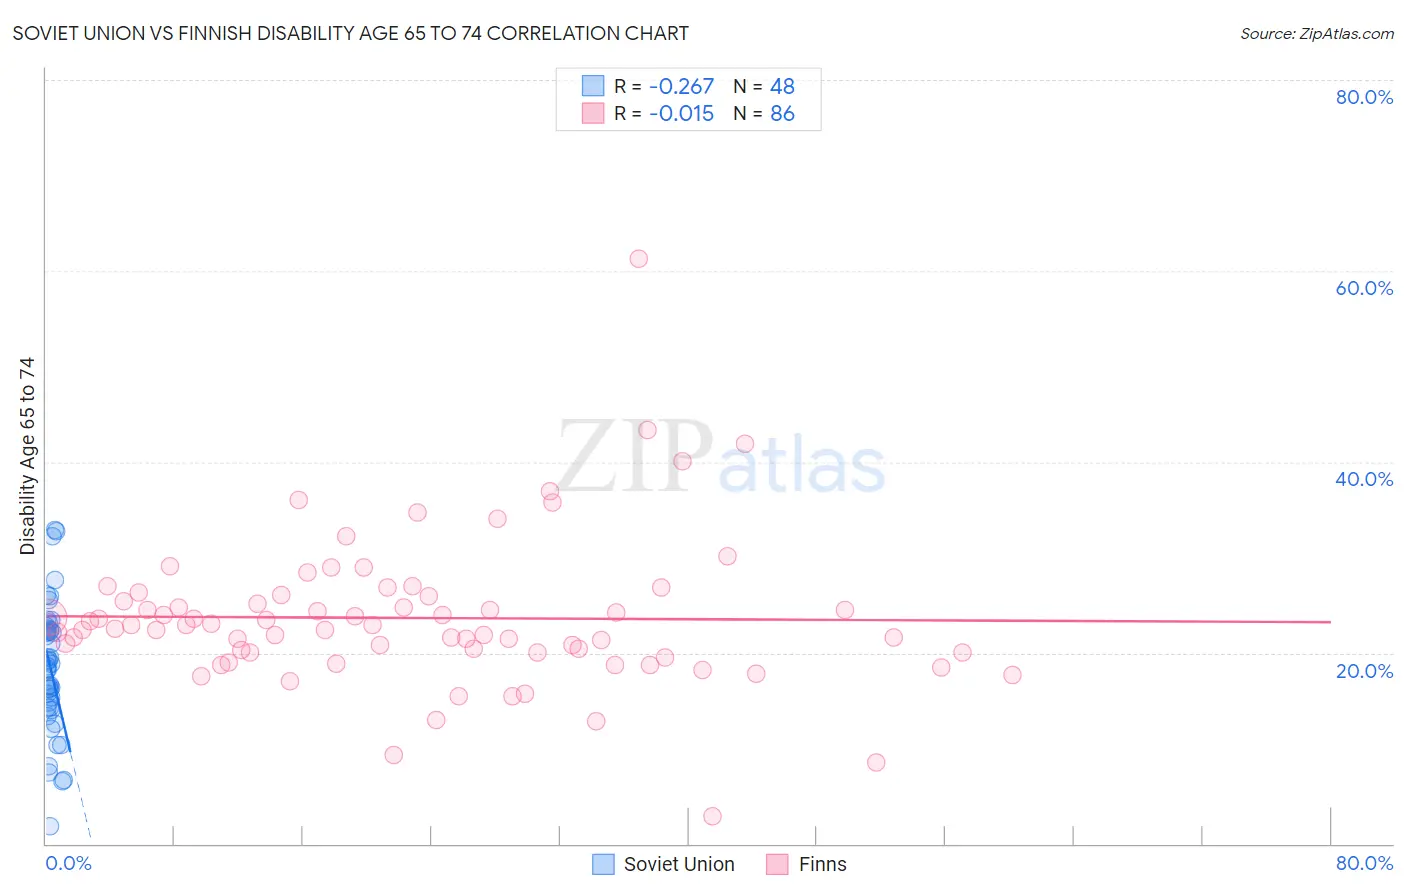
Soviet Union vs Finnish Disability Age 65 to 74 Correlation Chart
The statistical analysis conducted on geographies consisting of 43,509,359 people shows a weak negative correlation between the proportion of Soviet Union and percentage of population with a disability between the ages 65 and 75 in the United States with a correlation coefficient (R) of -0.267 and weighted average of 21.0%. Similarly, the statistical analysis conducted on geographies consisting of 404,031,913 people shows no correlation between the proportion of Finns and percentage of population with a disability between the ages 65 and 75 in the United States with a correlation coefficient (R) of -0.015 and weighted average of 22.9%, a difference of 9.4%.
Disability Age 65 to 74 Correlation Summary
| Measurement | Soviet Union | Finnish |
| Minimum | 1.8% | 2.9% |
| Maximum | 32.9% | 61.3% |
| Range | 31.0% | 58.3% |
| Mean | 18.4% | 23.7% |
| Median | 18.7% | 22.7% |
| Interquartile 25% (IQ1) | 14.3% | 20.0% |
| Interquartile 75% (IQ3) | 22.4% | 25.9% |
| Interquartile Range (IQR) | 8.2% | 5.9% |
| Standard Deviation (Sample) | 6.8% | 7.8% |
| Standard Deviation (Population) | 6.7% | 7.8% |
Similar Demographics by Disability Age 65 to 74
Demographics Similar to Soviet Union by Disability Age 65 to 74
In terms of disability age 65 to 74, the demographic groups most similar to Soviet Union are Bolivian (21.0%, a difference of 0.040%), Immigrants from Belgium (21.0%, a difference of 0.050%), Immigrants from Australia (21.0%, a difference of 0.060%), Immigrants from Sweden (21.0%, a difference of 0.080%), and Immigrants from Czechoslovakia (21.0%, a difference of 0.18%).
| Demographics | Rating | Rank | Disability Age 65 to 74 |
| Immigrants | South Central Asia | 100.0 /100 | #17 | Exceptional 20.6% |
| Eastern Europeans | 100.0 /100 | #18 | Exceptional 20.6% |
| Burmese | 100.0 /100 | #19 | Exceptional 20.6% |
| Okinawans | 100.0 /100 | #20 | Exceptional 20.7% |
| Immigrants | Bolivia | 99.9 /100 | #21 | Exceptional 20.8% |
| Immigrants | Iran | 99.9 /100 | #22 | Exceptional 20.9% |
| Immigrants | Belgium | 99.9 /100 | #23 | Exceptional 21.0% |
| Soviet Union | 99.9 /100 | #24 | Exceptional 21.0% |
| Bolivians | 99.9 /100 | #25 | Exceptional 21.0% |
| Immigrants | Australia | 99.9 /100 | #26 | Exceptional 21.0% |
| Immigrants | Sweden | 99.9 /100 | #27 | Exceptional 21.0% |
| Immigrants | Czechoslovakia | 99.9 /100 | #28 | Exceptional 21.0% |
| Immigrants | Japan | 99.9 /100 | #29 | Exceptional 21.0% |
| Immigrants | Greece | 99.9 /100 | #30 | Exceptional 21.0% |
| Immigrants | Northern Europe | 99.9 /100 | #31 | Exceptional 21.0% |
Demographics Similar to Finns by Disability Age 65 to 74
In terms of disability age 65 to 74, the demographic groups most similar to Finns are Canadian (22.9%, a difference of 0.090%), Immigrants from Morocco (22.9%, a difference of 0.090%), Slavic (23.0%, a difference of 0.11%), Sri Lankan (23.0%, a difference of 0.20%), and British (23.0%, a difference of 0.21%).
| Demographics | Rating | Rank | Disability Age 65 to 74 |
| Immigrants | Uganda | 84.0 /100 | #145 | Excellent 22.8% |
| Alsatians | 83.7 /100 | #146 | Excellent 22.8% |
| Immigrants | Uzbekistan | 83.1 /100 | #147 | Excellent 22.8% |
| New Zealanders | 79.9 /100 | #148 | Good 22.9% |
| Swiss | 79.7 /100 | #149 | Good 22.9% |
| Canadians | 77.7 /100 | #150 | Good 22.9% |
| Immigrants | Morocco | 77.6 /100 | #151 | Good 22.9% |
| Finns | 76.5 /100 | #152 | Good 22.9% |
| Slavs | 75.2 /100 | #153 | Good 23.0% |
| Sri Lankans | 74.0 /100 | #154 | Good 23.0% |
| British | 73.9 /100 | #155 | Good 23.0% |
| Immigrants | Western Asia | 73.8 /100 | #156 | Good 23.0% |
| Czechoslovakians | 72.4 /100 | #157 | Good 23.0% |
| Immigrants | Vietnam | 69.1 /100 | #158 | Good 23.1% |
| South American Indians | 65.5 /100 | #159 | Good 23.1% |