Tohono O'odham vs Venezuelan Disability Age 65 to 74
COMPARE
Tohono O'odham
Venezuelan
Disability Age 65 to 74
Disability Age 65 to 74 Comparison
Tohono O'odham
Venezuelans
36.0%
DISABILITY AGE 65 TO 74
0.0/ 100
METRIC RATING
345th/ 347
METRIC RANK
21.8%
DISABILITY AGE 65 TO 74
99.0/ 100
METRIC RATING
79th/ 347
METRIC RANK
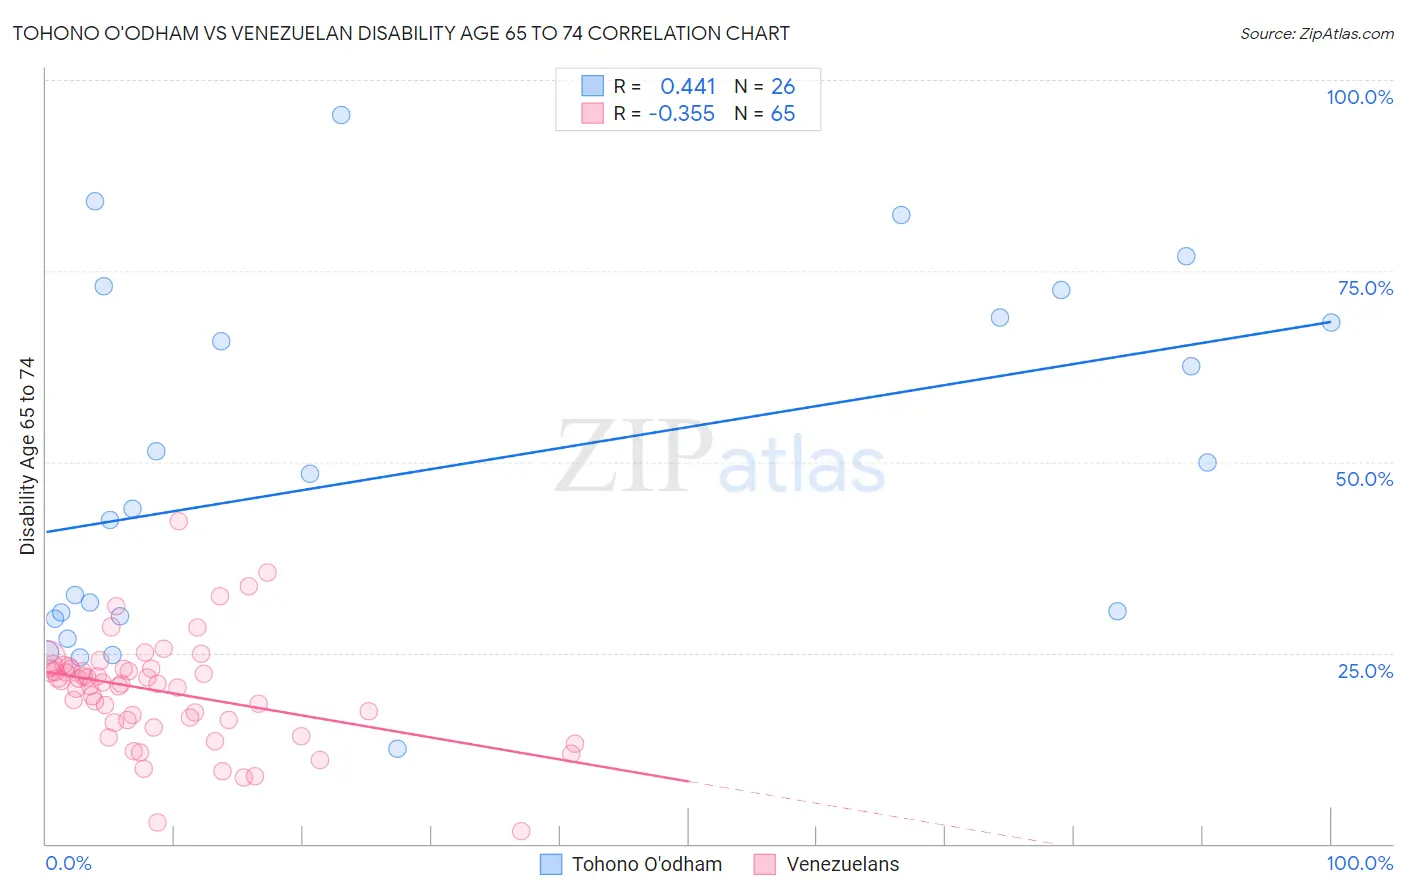
Tohono O'odham vs Venezuelan Disability Age 65 to 74 Correlation Chart
The statistical analysis conducted on geographies consisting of 58,691,657 people shows a moderate positive correlation between the proportion of Tohono O'odham and percentage of population with a disability between the ages 65 and 75 in the United States with a correlation coefficient (R) of 0.441 and weighted average of 36.0%. Similarly, the statistical analysis conducted on geographies consisting of 305,747,321 people shows a mild negative correlation between the proportion of Venezuelans and percentage of population with a disability between the ages 65 and 75 in the United States with a correlation coefficient (R) of -0.355 and weighted average of 21.8%, a difference of 65.3%.
Disability Age 65 to 74 Correlation Summary
| Measurement | Tohono O'odham | Venezuelan |
| Minimum | 12.4% | 1.6% |
| Maximum | 95.5% | 42.3% |
| Range | 83.1% | 40.7% |
| Mean | 49.4% | 19.9% |
| Median | 46.1% | 20.9% |
| Interquartile 25% (IQ1) | 29.8% | 16.1% |
| Interquartile 75% (IQ3) | 69.0% | 22.9% |
| Interquartile Range (IQR) | 39.1% | 6.9% |
| Standard Deviation (Sample) | 23.1% | 7.1% |
| Standard Deviation (Population) | 22.6% | 7.0% |
Similar Demographics by Disability Age 65 to 74
Demographics Similar to Tohono O'odham by Disability Age 65 to 74
In terms of disability age 65 to 74, the demographic groups most similar to Tohono O'odham are Inupiat (34.5%, a difference of 4.3%), Yup'ik (37.8%, a difference of 5.0%), Pima (38.6%, a difference of 7.1%), Navajo (33.3%, a difference of 8.1%), and Pueblo (33.1%, a difference of 8.9%).
| Demographics | Rating | Rank | Disability Age 65 to 74 |
| Colville | 0.0 /100 | #333 | Tragic 30.5% |
| Alaska Natives | 0.0 /100 | #334 | Tragic 30.6% |
| Cheyenne | 0.0 /100 | #335 | Tragic 31.1% |
| Yuman | 0.0 /100 | #336 | Tragic 31.5% |
| Houma | 0.0 /100 | #337 | Tragic 32.3% |
| Alaskan Athabascans | 0.0 /100 | #338 | Tragic 32.4% |
| Kiowa | 0.0 /100 | #339 | Tragic 32.6% |
| Lumbee | 0.0 /100 | #340 | Tragic 32.7% |
| Tsimshian | 0.0 /100 | #341 | Tragic 32.9% |
| Pueblo | 0.0 /100 | #342 | Tragic 33.1% |
| Navajo | 0.0 /100 | #343 | Tragic 33.3% |
| Inupiat | 0.0 /100 | #344 | Tragic 34.5% |
| Tohono O'odham | 0.0 /100 | #345 | Tragic 36.0% |
| Yup'ik | 0.0 /100 | #346 | Tragic 37.8% |
| Pima | 0.0 /100 | #347 | Tragic 38.6% |
Demographics Similar to Venezuelans by Disability Age 65 to 74
In terms of disability age 65 to 74, the demographic groups most similar to Venezuelans are Immigrants from Eastern Europe (21.8%, a difference of 0.0%), Immigrants from Norway (21.8%, a difference of 0.010%), Immigrants from Poland (21.8%, a difference of 0.060%), Croatian (21.8%, a difference of 0.080%), and Greek (21.8%, a difference of 0.12%).
| Demographics | Rating | Rank | Disability Age 65 to 74 |
| Immigrants | Hungary | 99.2 /100 | #72 | Exceptional 21.7% |
| Immigrants | Venezuela | 99.0 /100 | #73 | Exceptional 21.8% |
| Cambodians | 99.0 /100 | #74 | Exceptional 21.8% |
| Mongolians | 99.0 /100 | #75 | Exceptional 21.8% |
| Greeks | 99.0 /100 | #76 | Exceptional 21.8% |
| Immigrants | Poland | 99.0 /100 | #77 | Exceptional 21.8% |
| Immigrants | Eastern Europe | 99.0 /100 | #78 | Exceptional 21.8% |
| Venezuelans | 99.0 /100 | #79 | Exceptional 21.8% |
| Immigrants | Norway | 98.9 /100 | #80 | Exceptional 21.8% |
| Croatians | 98.9 /100 | #81 | Exceptional 21.8% |
| Immigrants | Indonesia | 98.7 /100 | #82 | Exceptional 21.9% |
| Immigrants | Brazil | 98.5 /100 | #83 | Exceptional 21.9% |
| Immigrants | Spain | 98.5 /100 | #84 | Exceptional 21.9% |
| Immigrants | Lebanon | 98.4 /100 | #85 | Exceptional 21.9% |
| South Africans | 98.4 /100 | #86 | Exceptional 21.9% |