Immigrants from Jamaica vs Finnish Disability Age 65 to 74
COMPARE
Immigrants from Jamaica
Finnish
Disability Age 65 to 74
Disability Age 65 to 74 Comparison
Immigrants from Jamaica
Finns
23.8%
DISABILITY AGE 65 TO 74
20.7/ 100
METRIC RATING
206th/ 347
METRIC RANK
22.9%
DISABILITY AGE 65 TO 74
76.5/ 100
METRIC RATING
152nd/ 347
METRIC RANK
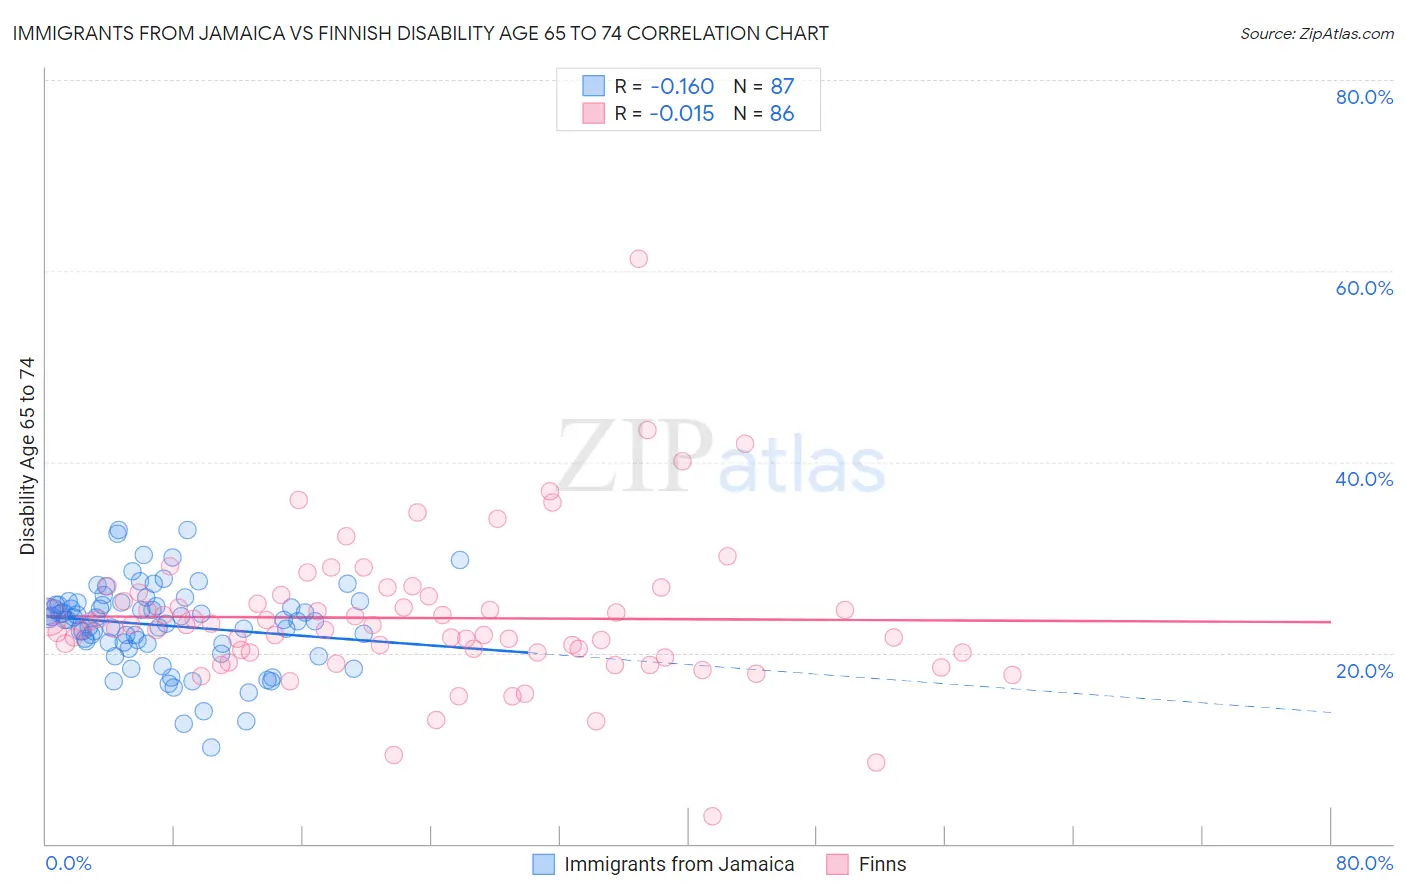
Immigrants from Jamaica vs Finnish Disability Age 65 to 74 Correlation Chart
The statistical analysis conducted on geographies consisting of 301,108,871 people shows a poor negative correlation between the proportion of Immigrants from Jamaica and percentage of population with a disability between the ages 65 and 75 in the United States with a correlation coefficient (R) of -0.160 and weighted average of 23.8%. Similarly, the statistical analysis conducted on geographies consisting of 404,031,913 people shows no correlation between the proportion of Finns and percentage of population with a disability between the ages 65 and 75 in the United States with a correlation coefficient (R) of -0.015 and weighted average of 22.9%, a difference of 3.7%.
Disability Age 65 to 74 Correlation Summary
| Measurement | Immigrants from Jamaica | Finnish |
| Minimum | 10.1% | 2.9% |
| Maximum | 32.9% | 61.3% |
| Range | 22.8% | 58.3% |
| Mean | 22.9% | 23.7% |
| Median | 23.5% | 22.7% |
| Interquartile 25% (IQ1) | 20.9% | 20.0% |
| Interquartile 75% (IQ3) | 25.1% | 25.9% |
| Interquartile Range (IQR) | 4.1% | 5.9% |
| Standard Deviation (Sample) | 4.3% | 7.8% |
| Standard Deviation (Population) | 4.3% | 7.8% |
Similar Demographics by Disability Age 65 to 74
Demographics Similar to Immigrants from Jamaica by Disability Age 65 to 74
In terms of disability age 65 to 74, the demographic groups most similar to Immigrants from Jamaica are Tongan (23.8%, a difference of 0.0%), Immigrants from Sudan (23.8%, a difference of 0.060%), Immigrants from Barbados (23.8%, a difference of 0.10%), Immigrants from Grenada (23.8%, a difference of 0.11%), and Immigrants from Kenya (23.8%, a difference of 0.11%).
| Demographics | Rating | Rank | Disability Age 65 to 74 |
| Welsh | 24.3 /100 | #199 | Fair 23.7% |
| French Canadians | 24.0 /100 | #200 | Fair 23.7% |
| Immigrants | Ecuador | 23.9 /100 | #201 | Fair 23.7% |
| Immigrants | Bahamas | 23.3 /100 | #202 | Fair 23.7% |
| Kenyans | 23.2 /100 | #203 | Fair 23.7% |
| Immigrants | Grenada | 22.1 /100 | #204 | Fair 23.8% |
| Tongans | 20.8 /100 | #205 | Fair 23.8% |
| Immigrants | Jamaica | 20.7 /100 | #206 | Fair 23.8% |
| Immigrants | Sudan | 20.1 /100 | #207 | Fair 23.8% |
| Immigrants | Barbados | 19.6 /100 | #208 | Poor 23.8% |
| Immigrants | Kenya | 19.6 /100 | #209 | Poor 23.8% |
| Trinidadians and Tobagonians | 16.4 /100 | #210 | Poor 23.9% |
| Immigrants | West Indies | 15.9 /100 | #211 | Poor 23.9% |
| French | 15.7 /100 | #212 | Poor 23.9% |
| Nicaraguans | 14.3 /100 | #213 | Poor 23.9% |
Demographics Similar to Finns by Disability Age 65 to 74
In terms of disability age 65 to 74, the demographic groups most similar to Finns are Canadian (22.9%, a difference of 0.090%), Immigrants from Morocco (22.9%, a difference of 0.090%), Slavic (23.0%, a difference of 0.11%), Sri Lankan (23.0%, a difference of 0.20%), and British (23.0%, a difference of 0.21%).
| Demographics | Rating | Rank | Disability Age 65 to 74 |
| Immigrants | Uganda | 84.0 /100 | #145 | Excellent 22.8% |
| Alsatians | 83.7 /100 | #146 | Excellent 22.8% |
| Immigrants | Uzbekistan | 83.1 /100 | #147 | Excellent 22.8% |
| New Zealanders | 79.9 /100 | #148 | Good 22.9% |
| Swiss | 79.7 /100 | #149 | Good 22.9% |
| Canadians | 77.7 /100 | #150 | Good 22.9% |
| Immigrants | Morocco | 77.6 /100 | #151 | Good 22.9% |
| Finns | 76.5 /100 | #152 | Good 22.9% |
| Slavs | 75.2 /100 | #153 | Good 23.0% |
| Sri Lankans | 74.0 /100 | #154 | Good 23.0% |
| British | 73.9 /100 | #155 | Good 23.0% |
| Immigrants | Western Asia | 73.8 /100 | #156 | Good 23.0% |
| Czechoslovakians | 72.4 /100 | #157 | Good 23.0% |
| Immigrants | Vietnam | 69.1 /100 | #158 | Good 23.1% |
| South American Indians | 65.5 /100 | #159 | Good 23.1% |