Tohono O'odham vs Asian 8th Grade
COMPARE
Tohono O'odham
Asian
8th Grade
8th Grade Comparison
Tohono O'odham
Asians
94.5%
8TH GRADE
0.0/ 100
METRIC RATING
287th/ 347
METRIC RANK
95.2%
8TH GRADE
3.5/ 100
METRIC RATING
231st/ 347
METRIC RANK
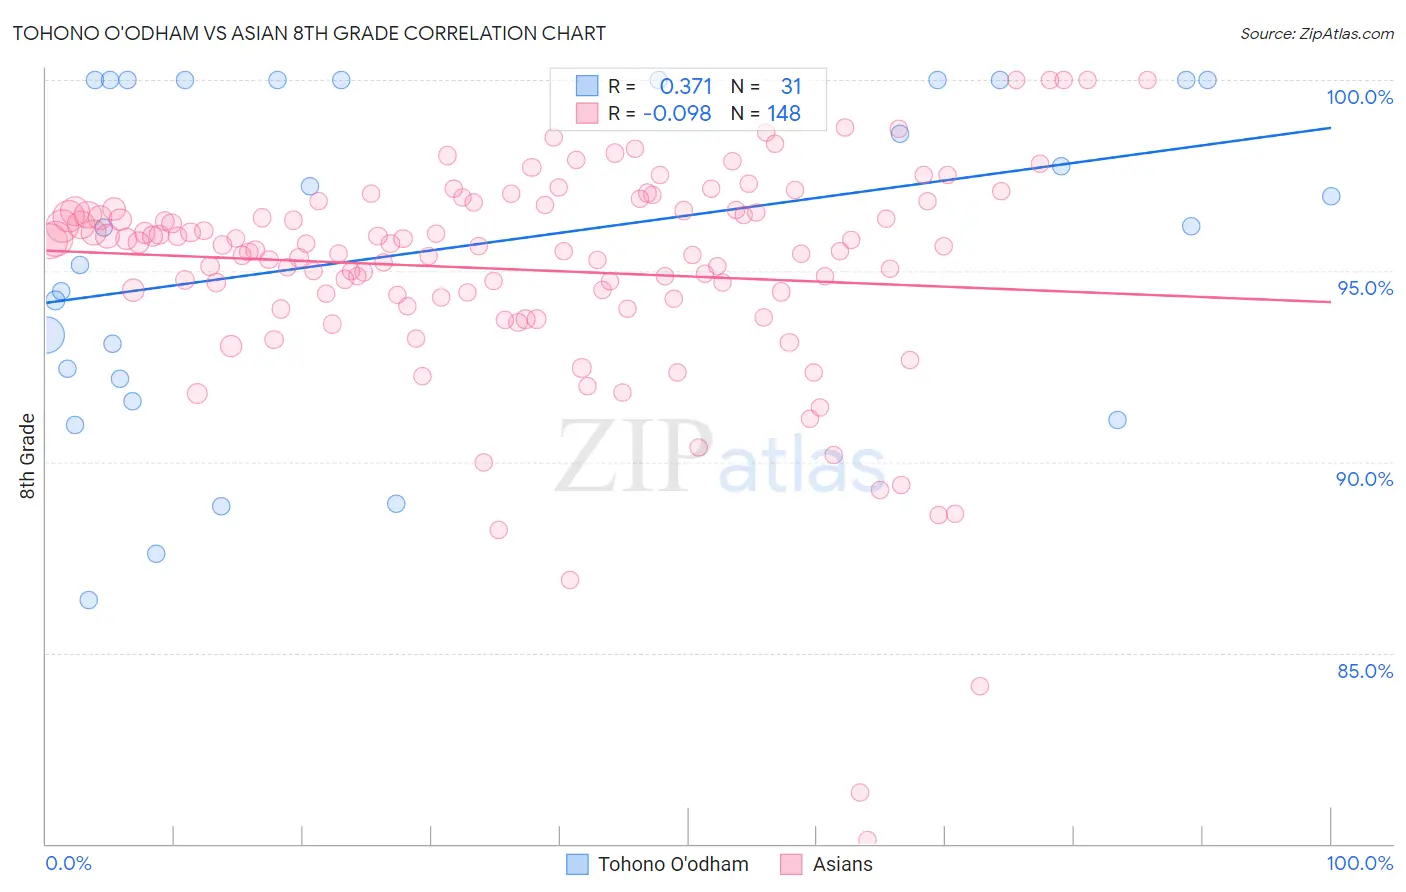
Tohono O'odham vs Asian 8th Grade Correlation Chart
The statistical analysis conducted on geographies consisting of 58,730,615 people shows a mild positive correlation between the proportion of Tohono O'odham and percentage of population with at least 8th grade education in the United States with a correlation coefficient (R) of 0.371 and weighted average of 94.5%. Similarly, the statistical analysis conducted on geographies consisting of 550,917,032 people shows a slight negative correlation between the proportion of Asians and percentage of population with at least 8th grade education in the United States with a correlation coefficient (R) of -0.098 and weighted average of 95.2%, a difference of 0.78%.
8th Grade Correlation Summary
| Measurement | Tohono O'odham | Asian |
| Minimum | 86.4% | 80.1% |
| Maximum | 100.0% | 100.0% |
| Range | 13.6% | 19.9% |
| Mean | 95.6% | 95.0% |
| Median | 96.2% | 95.6% |
| Interquartile 25% (IQ1) | 92.2% | 94.3% |
| Interquartile 75% (IQ3) | 100.0% | 96.6% |
| Interquartile Range (IQR) | 7.8% | 2.3% |
| Standard Deviation (Sample) | 4.3% | 3.0% |
| Standard Deviation (Population) | 4.3% | 3.0% |
Similar Demographics by 8th Grade
Demographics Similar to Tohono O'odham by 8th Grade
In terms of 8th grade, the demographic groups most similar to Tohono O'odham are Immigrants from Peru (94.5%, a difference of 0.0%), Malaysian (94.5%, a difference of 0.020%), Immigrants from Barbados (94.5%, a difference of 0.060%), Immigrants from Philippines (94.6%, a difference of 0.090%), and British West Indian (94.4%, a difference of 0.090%).
| Demographics | Rating | Rank | 8th Grade |
| Barbadians | 0.1 /100 | #280 | Tragic 94.6% |
| Immigrants | Bolivia | 0.1 /100 | #281 | Tragic 94.6% |
| Immigrants | Eritrea | 0.1 /100 | #282 | Tragic 94.6% |
| Immigrants | St. Vincent and the Grenadines | 0.1 /100 | #283 | Tragic 94.6% |
| Immigrants | Philippines | 0.1 /100 | #284 | Tragic 94.6% |
| Immigrants | Barbados | 0.0 /100 | #285 | Tragic 94.5% |
| Immigrants | Peru | 0.0 /100 | #286 | Tragic 94.5% |
| Tohono O'odham | 0.0 /100 | #287 | Tragic 94.5% |
| Malaysians | 0.0 /100 | #288 | Tragic 94.5% |
| British West Indians | 0.0 /100 | #289 | Tragic 94.4% |
| Immigrants | West Indies | 0.0 /100 | #290 | Tragic 94.3% |
| Immigrants | Grenada | 0.0 /100 | #291 | Tragic 94.3% |
| Bangladeshis | 0.0 /100 | #292 | Tragic 94.3% |
| Yaqui | 0.0 /100 | #293 | Tragic 94.2% |
| Houma | 0.0 /100 | #294 | Tragic 94.2% |
Demographics Similar to Asians by 8th Grade
In terms of 8th grade, the demographic groups most similar to Asians are Indian (Asian) (95.2%, a difference of 0.010%), Immigrants from Asia (95.2%, a difference of 0.020%), Costa Rican (95.2%, a difference of 0.020%), Immigrants from Panama (95.2%, a difference of 0.030%), and Nigerian (95.2%, a difference of 0.030%).
| Demographics | Rating | Rank | 8th Grade |
| Immigrants | Western Asia | 6.0 /100 | #224 | Tragic 95.3% |
| Sub-Saharan Africans | 6.0 /100 | #225 | Tragic 95.3% |
| Navajo | 5.7 /100 | #226 | Tragic 95.3% |
| Bahamians | 5.6 /100 | #227 | Tragic 95.3% |
| Immigrants | Eastern Africa | 5.6 /100 | #228 | Tragic 95.3% |
| Immigrants | Indonesia | 4.4 /100 | #229 | Tragic 95.3% |
| Immigrants | Panama | 4.1 /100 | #230 | Tragic 95.2% |
| Asians | 3.5 /100 | #231 | Tragic 95.2% |
| Indians (Asian) | 3.3 /100 | #232 | Tragic 95.2% |
| Immigrants | Asia | 3.1 /100 | #233 | Tragic 95.2% |
| Costa Ricans | 3.0 /100 | #234 | Tragic 95.2% |
| Nigerians | 2.9 /100 | #235 | Tragic 95.2% |
| Senegalese | 2.7 /100 | #236 | Tragic 95.2% |
| Immigrants | Africa | 2.7 /100 | #237 | Tragic 95.2% |
| Natives/Alaskans | 2.3 /100 | #238 | Tragic 95.2% |