Navajo vs Immigrants from Haiti Vision Disability
COMPARE
Navajo
Immigrants from Haiti
Vision Disability
Vision Disability Comparison
Navajo
Immigrants from Haiti
3.1%
VISION DISABILITY
0.0/ 100
METRIC RATING
335th/ 347
METRIC RANK
2.4%
VISION DISABILITY
0.2/ 100
METRIC RATING
256th/ 347
METRIC RANK
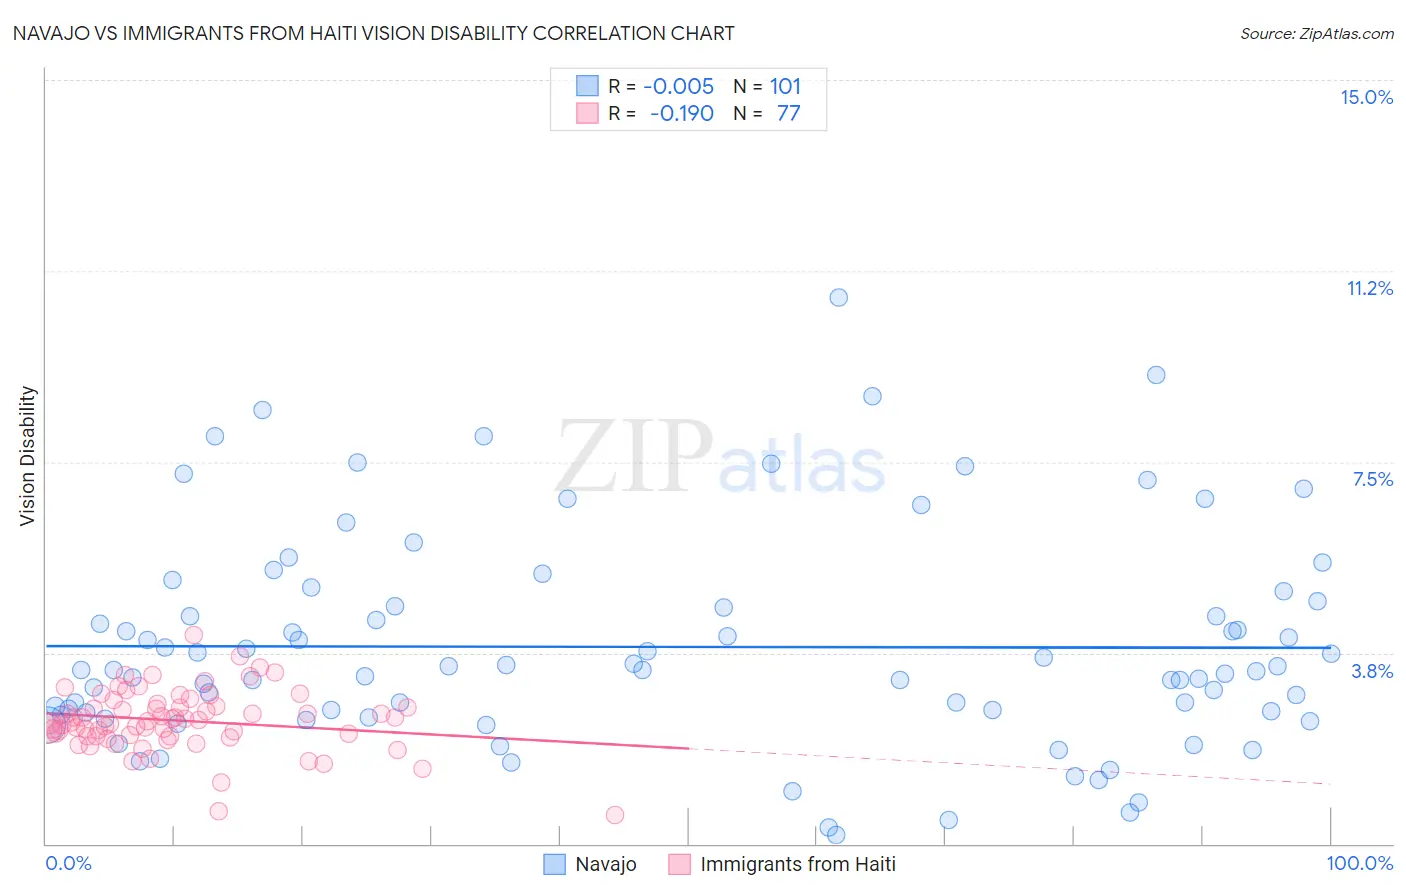
Navajo vs Immigrants from Haiti Vision Disability Correlation Chart
The statistical analysis conducted on geographies consisting of 224,647,940 people shows no correlation between the proportion of Navajo and percentage of population with vision disability in the United States with a correlation coefficient (R) of -0.005 and weighted average of 3.1%. Similarly, the statistical analysis conducted on geographies consisting of 225,143,301 people shows a poor negative correlation between the proportion of Immigrants from Haiti and percentage of population with vision disability in the United States with a correlation coefficient (R) of -0.190 and weighted average of 2.4%, a difference of 32.3%.
Vision Disability Correlation Summary
| Measurement | Navajo | Immigrants from Haiti |
| Minimum | 0.16% | 0.56% |
| Maximum | 10.7% | 4.1% |
| Range | 10.6% | 3.5% |
| Mean | 3.9% | 2.4% |
| Median | 3.4% | 2.4% |
| Interquartile 25% (IQ1) | 2.6% | 2.1% |
| Interquartile 75% (IQ3) | 4.7% | 2.7% |
| Interquartile Range (IQR) | 2.2% | 0.60% |
| Standard Deviation (Sample) | 2.1% | 0.60% |
| Standard Deviation (Population) | 2.1% | 0.60% |
Similar Demographics by Vision Disability
Demographics Similar to Navajo by Vision Disability
In terms of vision disability, the demographic groups most similar to Navajo are Alaskan Athabascan (3.1%, a difference of 0.16%), Dutch West Indian (3.2%, a difference of 0.19%), Chickasaw (3.2%, a difference of 1.1%), Cheyenne (3.1%, a difference of 1.7%), and Tsimshian (3.2%, a difference of 1.8%).
| Demographics | Rating | Rank | Vision Disability |
| Yuman | 0.0 /100 | #328 | Tragic 3.0% |
| Apache | 0.0 /100 | #329 | Tragic 3.0% |
| Colville | 0.0 /100 | #330 | Tragic 3.0% |
| Central American Indians | 0.0 /100 | #331 | Tragic 3.0% |
| Seminole | 0.0 /100 | #332 | Tragic 3.1% |
| Cajuns | 0.0 /100 | #333 | Tragic 3.1% |
| Cheyenne | 0.0 /100 | #334 | Tragic 3.1% |
| Navajo | 0.0 /100 | #335 | Tragic 3.1% |
| Alaskan Athabascans | 0.0 /100 | #336 | Tragic 3.1% |
| Dutch West Indians | 0.0 /100 | #337 | Tragic 3.2% |
| Chickasaw | 0.0 /100 | #338 | Tragic 3.2% |
| Tsimshian | 0.0 /100 | #339 | Tragic 3.2% |
| Creek | 0.0 /100 | #340 | Tragic 3.2% |
| Kiowa | 0.0 /100 | #341 | Tragic 3.3% |
| Choctaw | 0.0 /100 | #342 | Tragic 3.3% |
Demographics Similar to Immigrants from Haiti by Vision Disability
In terms of vision disability, the demographic groups most similar to Immigrants from Haiti are West Indian (2.4%, a difference of 0.080%), British West Indian (2.4%, a difference of 0.10%), White/Caucasian (2.4%, a difference of 0.12%), Belizean (2.4%, a difference of 0.29%), and Immigrants from Guatemala (2.4%, a difference of 0.33%).
| Demographics | Rating | Rank | Vision Disability |
| Liberians | 0.5 /100 | #249 | Tragic 2.3% |
| Bangladeshis | 0.5 /100 | #250 | Tragic 2.3% |
| Immigrants | Laos | 0.4 /100 | #251 | Tragic 2.4% |
| Immigrants | Micronesia | 0.3 /100 | #252 | Tragic 2.4% |
| Japanese | 0.3 /100 | #253 | Tragic 2.4% |
| Haitians | 0.3 /100 | #254 | Tragic 2.4% |
| Immigrants | Guatemala | 0.3 /100 | #255 | Tragic 2.4% |
| Immigrants | Haiti | 0.2 /100 | #256 | Tragic 2.4% |
| West Indians | 0.2 /100 | #257 | Tragic 2.4% |
| British West Indians | 0.2 /100 | #258 | Tragic 2.4% |
| Whites/Caucasians | 0.2 /100 | #259 | Tragic 2.4% |
| Belizeans | 0.2 /100 | #260 | Tragic 2.4% |
| Fijians | 0.1 /100 | #261 | Tragic 2.4% |
| Jamaicans | 0.1 /100 | #262 | Tragic 2.4% |
| Immigrants | Belize | 0.1 /100 | #263 | Tragic 2.4% |