Syrian vs Immigrants from Israel Married-couple Households
COMPARE
Syrian
Immigrants from Israel
Married-couple Households
Married-couple Households Comparison
Syrians
Immigrants from Israel
47.6%
MARRIED-COUPLE HOUSEHOLDS
93.9/ 100
METRIC RATING
111th/ 347
METRIC RANK
48.0%
MARRIED-COUPLE HOUSEHOLDS
97.4/ 100
METRIC RATING
85th/ 347
METRIC RANK
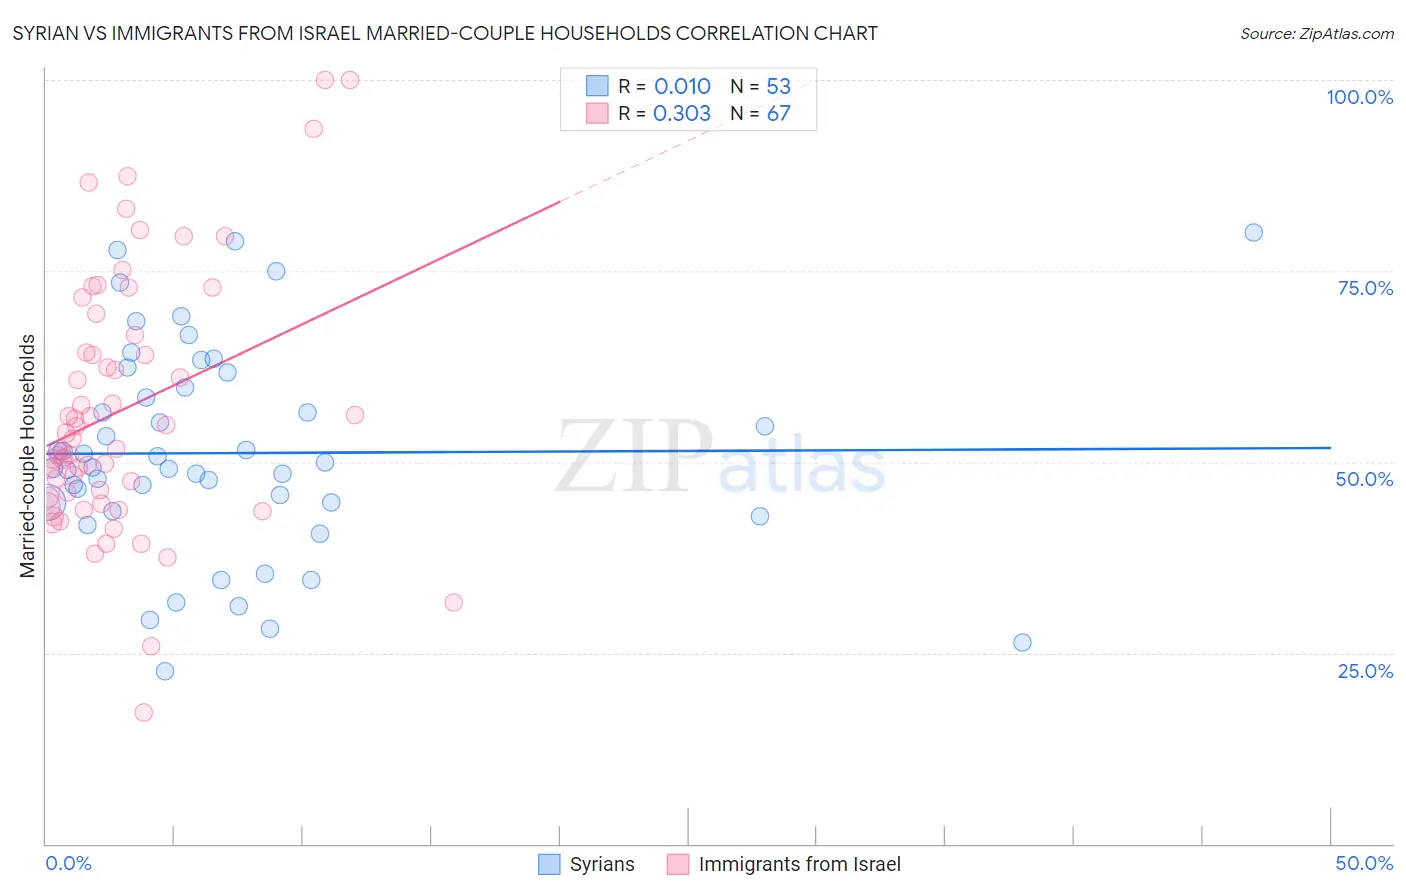
Syrian vs Immigrants from Israel Married-couple Households Correlation Chart
The statistical analysis conducted on geographies consisting of 266,174,556 people shows no correlation between the proportion of Syrians and percentage of married-couple family households in the United States with a correlation coefficient (R) of 0.010 and weighted average of 47.6%. Similarly, the statistical analysis conducted on geographies consisting of 209,978,634 people shows a mild positive correlation between the proportion of Immigrants from Israel and percentage of married-couple family households in the United States with a correlation coefficient (R) of 0.303 and weighted average of 48.0%, a difference of 0.83%.
Married-couple Households Correlation Summary
| Measurement | Syrian | Immigrants from Israel |
| Minimum | 22.6% | 17.2% |
| Maximum | 80.0% | 100.0% |
| Range | 57.4% | 82.8% |
| Mean | 51.2% | 56.9% |
| Median | 49.3% | 53.0% |
| Interquartile 25% (IQ1) | 44.1% | 45.4% |
| Interquartile 75% (IQ3) | 60.7% | 66.7% |
| Interquartile Range (IQR) | 16.7% | 21.3% |
| Standard Deviation (Sample) | 13.7% | 16.8% |
| Standard Deviation (Population) | 13.6% | 16.7% |
Similar Demographics by Married-couple Households
Demographics Similar to Syrians by Married-couple Households
In terms of married-couple households, the demographic groups most similar to Syrians are Macedonian (47.6%, a difference of 0.0%), Peruvian (47.6%, a difference of 0.010%), Venezuelan (47.6%, a difference of 0.020%), Immigrants from Jordan (47.7%, a difference of 0.030%), and Immigrants from Europe (47.6%, a difference of 0.030%).
| Demographics | Rating | Rank | Married-couple Households |
| Immigrants | South Africa | 96.0 /100 | #104 | Exceptional 47.8% |
| Immigrants | Czechoslovakia | 95.5 /100 | #105 | Exceptional 47.8% |
| Portuguese | 95.5 /100 | #106 | Exceptional 47.8% |
| Estonians | 94.7 /100 | #107 | Exceptional 47.7% |
| Immigrants | Japan | 94.4 /100 | #108 | Exceptional 47.7% |
| Immigrants | Jordan | 94.1 /100 | #109 | Exceptional 47.7% |
| Macedonians | 93.9 /100 | #110 | Exceptional 47.6% |
| Syrians | 93.9 /100 | #111 | Exceptional 47.6% |
| Peruvians | 93.8 /100 | #112 | Exceptional 47.6% |
| Venezuelans | 93.8 /100 | #113 | Exceptional 47.6% |
| Immigrants | Europe | 93.7 /100 | #114 | Exceptional 47.6% |
| Slovaks | 92.9 /100 | #115 | Exceptional 47.6% |
| Argentineans | 92.5 /100 | #116 | Exceptional 47.5% |
| French Canadians | 92.4 /100 | #117 | Exceptional 47.5% |
| Immigrants | Germany | 92.4 /100 | #118 | Exceptional 47.5% |
Demographics Similar to Immigrants from Israel by Married-couple Households
In terms of married-couple households, the demographic groups most similar to Immigrants from Israel are Belgian (48.0%, a difference of 0.030%), Immigrants from Ireland (48.0%, a difference of 0.040%), Afghan (48.0%, a difference of 0.040%), Ukrainian (48.1%, a difference of 0.050%), and Guamanian/Chamorro (48.1%, a difference of 0.070%).
| Demographics | Rating | Rank | Married-couple Households |
| Egyptians | 98.2 /100 | #78 | Exceptional 48.2% |
| Immigrants | Netherlands | 98.2 /100 | #79 | Exceptional 48.2% |
| Russians | 98.1 /100 | #80 | Exceptional 48.2% |
| Finns | 98.0 /100 | #81 | Exceptional 48.1% |
| Immigrants | Poland | 97.7 /100 | #82 | Exceptional 48.1% |
| Guamanians/Chamorros | 97.6 /100 | #83 | Exceptional 48.1% |
| Ukrainians | 97.6 /100 | #84 | Exceptional 48.1% |
| Immigrants | Israel | 97.4 /100 | #85 | Exceptional 48.0% |
| Belgians | 97.4 /100 | #86 | Exceptional 48.0% |
| Immigrants | Ireland | 97.3 /100 | #87 | Exceptional 48.0% |
| Afghans | 97.3 /100 | #88 | Exceptional 48.0% |
| Cypriots | 97.2 /100 | #89 | Exceptional 48.0% |
| French | 97.2 /100 | #90 | Exceptional 48.0% |
| Immigrants | Moldova | 97.0 /100 | #91 | Exceptional 48.0% |
| Palestinians | 96.9 /100 | #92 | Exceptional 48.0% |