Bhutanese vs Delaware Male Disability
COMPARE
Bhutanese
Delaware
Male Disability
Male Disability Comparison
Bhutanese
Delaware
11.0%
MALE DISABILITY
83.4/ 100
METRIC RATING
134th/ 347
METRIC RANK
13.5%
MALE DISABILITY
0.0/ 100
METRIC RATING
311th/ 347
METRIC RANK
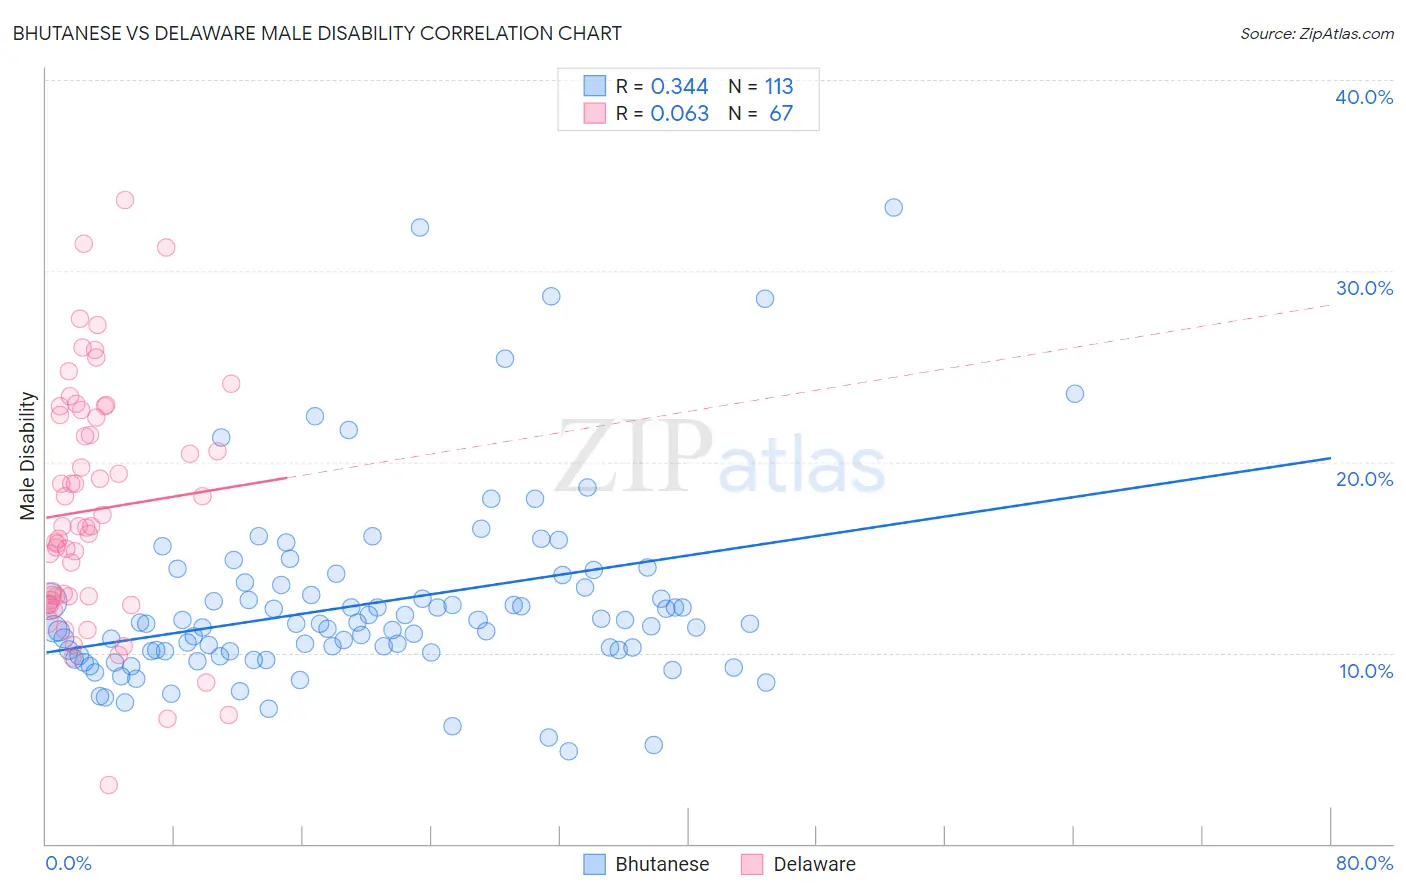
Bhutanese vs Delaware Male Disability Correlation Chart
The statistical analysis conducted on geographies consisting of 455,462,899 people shows a mild positive correlation between the proportion of Bhutanese and percentage of males with a disability in the United States with a correlation coefficient (R) of 0.344 and weighted average of 11.0%. Similarly, the statistical analysis conducted on geographies consisting of 96,239,516 people shows a slight positive correlation between the proportion of Delaware and percentage of males with a disability in the United States with a correlation coefficient (R) of 0.063 and weighted average of 13.5%, a difference of 22.8%.
Male Disability Correlation Summary
| Measurement | Bhutanese | Delaware |
| Minimum | 4.8% | 3.1% |
| Maximum | 33.3% | 33.7% |
| Range | 28.5% | 30.6% |
| Mean | 12.6% | 17.5% |
| Median | 11.5% | 16.6% |
| Interquartile 25% (IQ1) | 10.1% | 12.7% |
| Interquartile 75% (IQ3) | 13.5% | 22.4% |
| Interquartile Range (IQR) | 3.4% | 9.7% |
| Standard Deviation (Sample) | 5.0% | 6.3% |
| Standard Deviation (Population) | 4.9% | 6.2% |
Similar Demographics by Male Disability
Demographics Similar to Bhutanese by Male Disability
In terms of male disability, the demographic groups most similar to Bhutanese are Trinidadian and Tobagonian (11.0%, a difference of 0.010%), Ugandan (11.0%, a difference of 0.050%), Immigrants from Costa Rica (11.0%, a difference of 0.060%), Immigrants from Fiji (11.0%, a difference of 0.070%), and Macedonian (11.0%, a difference of 0.080%).
| Demographics | Rating | Rank | Male Disability |
| Immigrants | Ukraine | 86.8 /100 | #127 | Excellent 10.9% |
| Immigrants | Latvia | 85.5 /100 | #128 | Excellent 10.9% |
| Immigrants | Philippines | 85.4 /100 | #129 | Excellent 10.9% |
| Brazilians | 85.4 /100 | #130 | Excellent 10.9% |
| Macedonians | 84.2 /100 | #131 | Excellent 11.0% |
| Immigrants | Fiji | 84.0 /100 | #132 | Excellent 11.0% |
| Ugandans | 83.9 /100 | #133 | Excellent 11.0% |
| Bhutanese | 83.4 /100 | #134 | Excellent 11.0% |
| Trinidadians and Tobagonians | 83.3 /100 | #135 | Excellent 11.0% |
| Immigrants | Costa Rica | 82.8 /100 | #136 | Excellent 11.0% |
| Immigrants | Europe | 82.0 /100 | #137 | Excellent 11.0% |
| Nigerians | 81.9 /100 | #138 | Excellent 11.0% |
| South Africans | 81.7 /100 | #139 | Excellent 11.0% |
| Immigrants | Italy | 81.5 /100 | #140 | Excellent 11.0% |
| Arabs | 81.5 /100 | #141 | Excellent 11.0% |
Demographics Similar to Delaware by Male Disability
In terms of male disability, the demographic groups most similar to Delaware are Immigrants from the Azores (13.4%, a difference of 0.19%), Blackfeet (13.4%, a difference of 0.33%), Yakama (13.5%, a difference of 0.55%), Puget Sound Salish (13.5%, a difference of 0.57%), and Aleut (13.5%, a difference of 0.63%).
| Demographics | Rating | Rank | Male Disability |
| Blacks/African Americans | 0.0 /100 | #304 | Tragic 13.2% |
| French Canadians | 0.0 /100 | #305 | Tragic 13.3% |
| Spanish Americans | 0.0 /100 | #306 | Tragic 13.3% |
| Arapaho | 0.0 /100 | #307 | Tragic 13.3% |
| French American Indians | 0.0 /100 | #308 | Tragic 13.4% |
| Blackfeet | 0.0 /100 | #309 | Tragic 13.4% |
| Immigrants | Azores | 0.0 /100 | #310 | Tragic 13.4% |
| Delaware | 0.0 /100 | #311 | Tragic 13.5% |
| Yakama | 0.0 /100 | #312 | Tragic 13.5% |
| Puget Sound Salish | 0.0 /100 | #313 | Tragic 13.5% |
| Aleuts | 0.0 /100 | #314 | Tragic 13.5% |
| Iroquois | 0.0 /100 | #315 | Tragic 13.6% |
| Alaska Natives | 0.0 /100 | #316 | Tragic 13.6% |
| Paiute | 0.0 /100 | #317 | Tragic 13.7% |
| Cree | 0.0 /100 | #318 | Tragic 13.7% |