Immigrants from Lithuania vs Chilean Hearing Disability
COMPARE
Immigrants from Lithuania
Chilean
Hearing Disability
Hearing Disability Comparison
Immigrants from Lithuania
Chileans
2.9%
HEARING DISABILITY
73.0/ 100
METRIC RATING
152nd/ 347
METRIC RANK
2.9%
HEARING DISABILITY
85.8/ 100
METRIC RATING
132nd/ 347
METRIC RANK
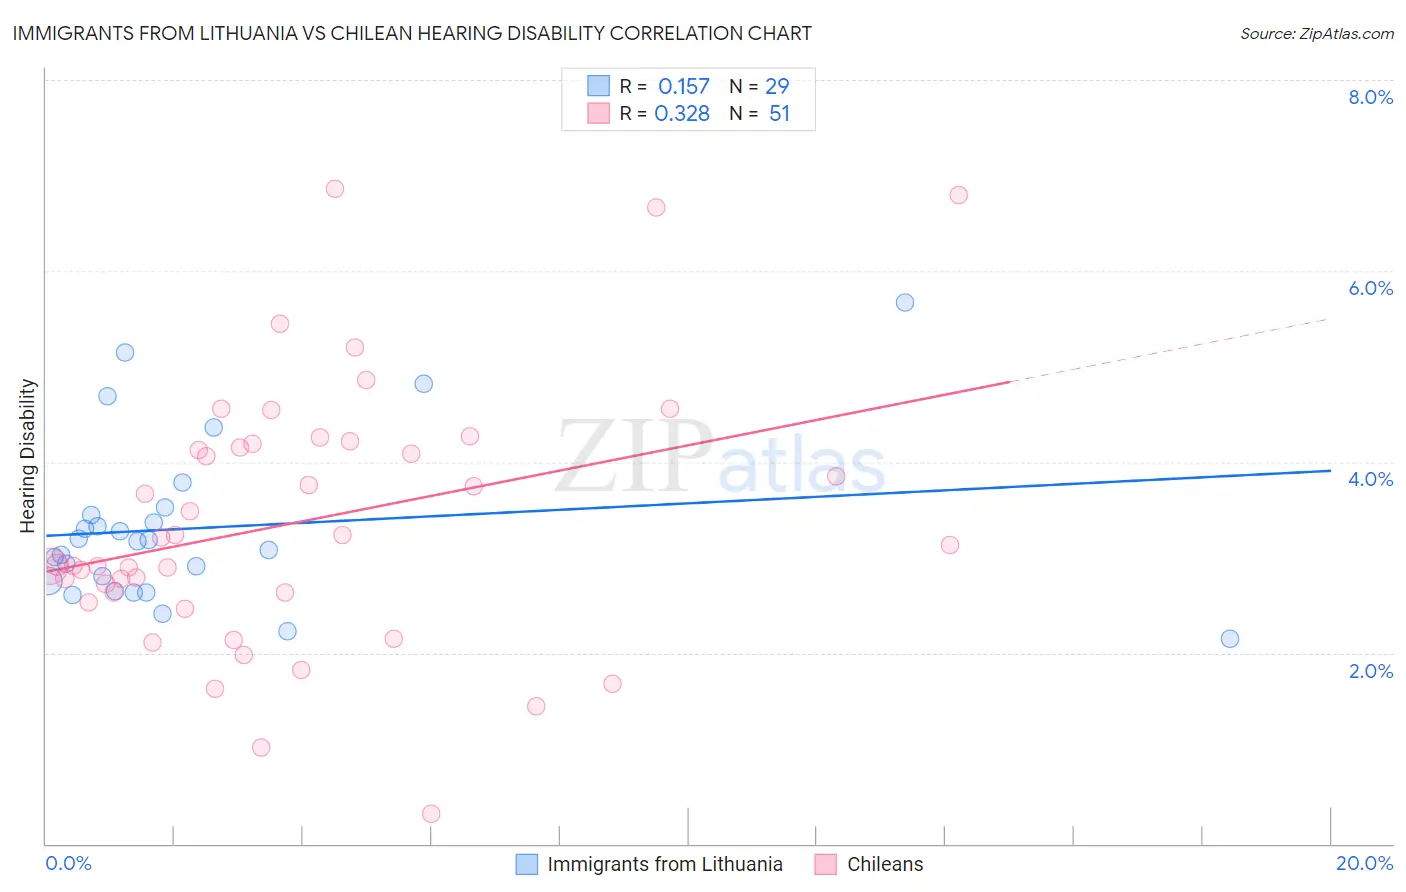
Immigrants from Lithuania vs Chilean Hearing Disability Correlation Chart
The statistical analysis conducted on geographies consisting of 117,714,489 people shows a poor positive correlation between the proportion of Immigrants from Lithuania and percentage of population with hearing disability in the United States with a correlation coefficient (R) of 0.157 and weighted average of 2.9%. Similarly, the statistical analysis conducted on geographies consisting of 256,625,228 people shows a mild positive correlation between the proportion of Chileans and percentage of population with hearing disability in the United States with a correlation coefficient (R) of 0.328 and weighted average of 2.9%, a difference of 2.0%.
Hearing Disability Correlation Summary
| Measurement | Immigrants from Lithuania | Chilean |
| Minimum | 2.1% | 0.32% |
| Maximum | 5.7% | 6.9% |
| Range | 3.5% | 6.5% |
| Mean | 3.3% | 3.4% |
| Median | 3.2% | 3.1% |
| Interquartile 25% (IQ1) | 2.7% | 2.6% |
| Interquartile 75% (IQ3) | 3.5% | 4.2% |
| Interquartile Range (IQR) | 0.78% | 1.6% |
| Standard Deviation (Sample) | 0.86% | 1.4% |
| Standard Deviation (Population) | 0.85% | 1.4% |
Demographics Similar to Immigrants from Lithuania and Chileans by Hearing Disability
In terms of hearing disability, the demographic groups most similar to Immigrants from Lithuania are Immigrants from France (2.9%, a difference of 0.010%), Palestinian (2.9%, a difference of 0.070%), Immigrants from Panama (2.9%, a difference of 0.50%), Immigrants from Russia (2.9%, a difference of 0.61%), and Tongan (2.9%, a difference of 0.75%). Similarly, the demographic groups most similar to Chileans are Immigrants from Syria (2.9%, a difference of 0.0%), Ugandan (2.9%, a difference of 0.070%), Soviet Union (2.9%, a difference of 0.21%), Immigrants from Brazil (2.9%, a difference of 0.24%), and Sri Lankan (2.9%, a difference of 0.34%).
| Demographics | Rating | Rank | Hearing Disability |
| Chileans | 85.8 /100 | #132 | Excellent 2.9% |
| Immigrants | Syria | 85.8 /100 | #133 | Excellent 2.9% |
| Ugandans | 85.5 /100 | #134 | Excellent 2.9% |
| Soviet Union | 84.8 /100 | #135 | Excellent 2.9% |
| Immigrants | Brazil | 84.6 /100 | #136 | Excellent 2.9% |
| Sri Lankans | 84.1 /100 | #137 | Excellent 2.9% |
| Immigrants | Costa Rica | 84.0 /100 | #138 | Excellent 2.9% |
| Bermudans | 83.8 /100 | #139 | Excellent 2.9% |
| Immigrants | Jordan | 83.7 /100 | #140 | Excellent 2.9% |
| Sub-Saharan Africans | 83.3 /100 | #141 | Excellent 2.9% |
| Laotians | 81.1 /100 | #142 | Excellent 2.9% |
| Immigrants | Bahamas | 80.9 /100 | #143 | Excellent 2.9% |
| Immigrants | Bulgaria | 79.2 /100 | #144 | Good 2.9% |
| Immigrants | Congo | 78.9 /100 | #145 | Good 2.9% |
| Brazilians | 78.7 /100 | #146 | Good 2.9% |
| Tongans | 78.6 /100 | #147 | Good 2.9% |
| Immigrants | Russia | 77.7 /100 | #148 | Good 2.9% |
| Immigrants | Panama | 76.9 /100 | #149 | Good 2.9% |
| Palestinians | 73.6 /100 | #150 | Good 2.9% |
| Immigrants | France | 73.1 /100 | #151 | Good 2.9% |
| Immigrants | Lithuania | 73.0 /100 | #152 | Good 2.9% |