Immigrants from Venezuela vs Chilean Hearing Disability
COMPARE
Immigrants from Venezuela
Chilean
Hearing Disability
Hearing Disability Comparison
Immigrants from Venezuela
Chileans
2.6%
HEARING DISABILITY
99.7/ 100
METRIC RATING
32nd/ 347
METRIC RANK
2.9%
HEARING DISABILITY
85.8/ 100
METRIC RATING
132nd/ 347
METRIC RANK
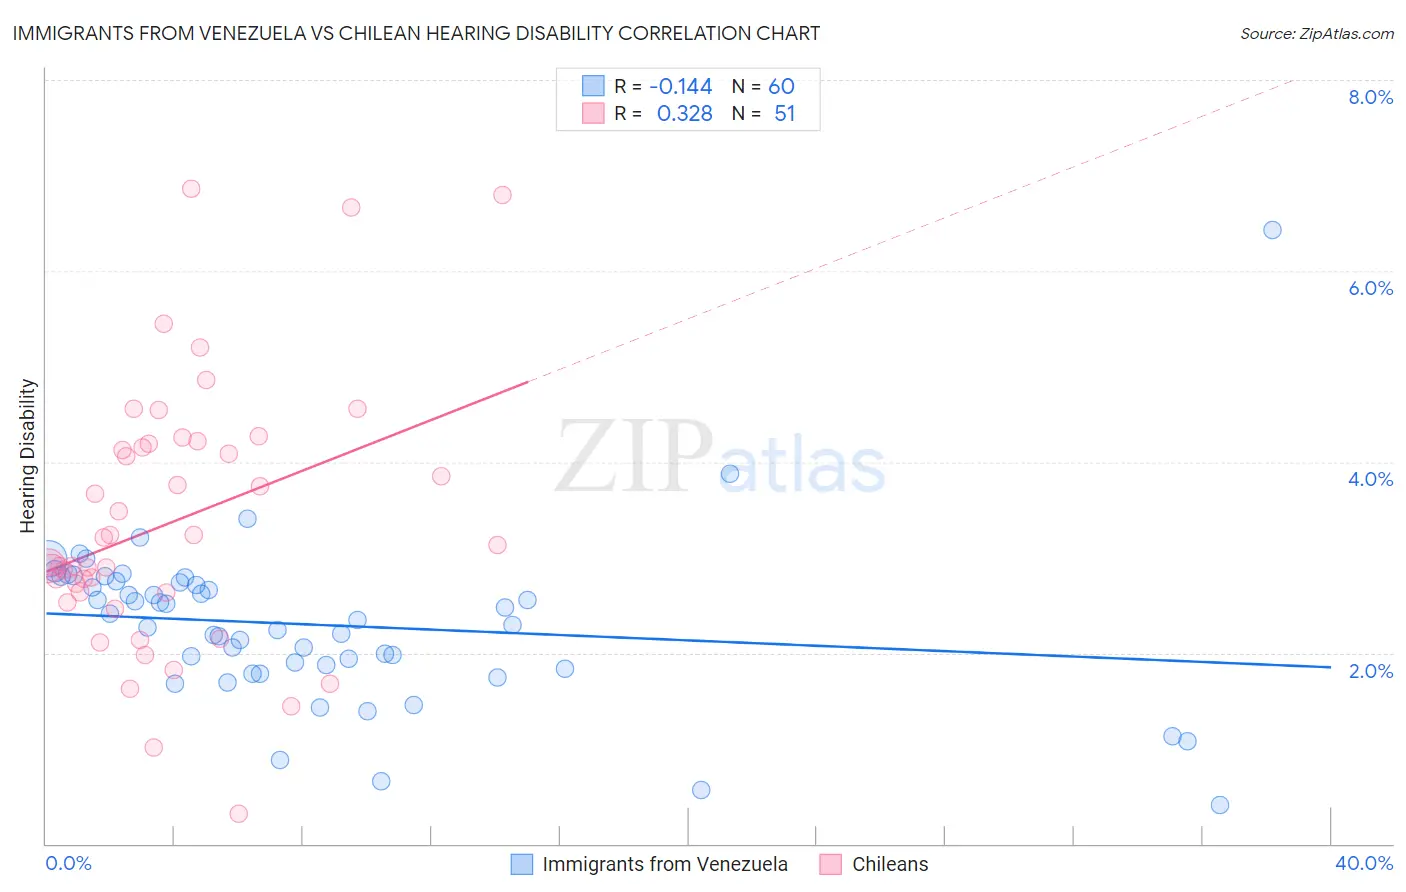
Immigrants from Venezuela vs Chilean Hearing Disability Correlation Chart
The statistical analysis conducted on geographies consisting of 287,826,264 people shows a poor negative correlation between the proportion of Immigrants from Venezuela and percentage of population with hearing disability in the United States with a correlation coefficient (R) of -0.144 and weighted average of 2.6%. Similarly, the statistical analysis conducted on geographies consisting of 256,625,228 people shows a mild positive correlation between the proportion of Chileans and percentage of population with hearing disability in the United States with a correlation coefficient (R) of 0.328 and weighted average of 2.9%, a difference of 10.4%.
Hearing Disability Correlation Summary
| Measurement | Immigrants from Venezuela | Chilean |
| Minimum | 0.40% | 0.32% |
| Maximum | 6.4% | 6.9% |
| Range | 6.0% | 6.5% |
| Mean | 2.3% | 3.4% |
| Median | 2.3% | 3.1% |
| Interquartile 25% (IQ1) | 1.9% | 2.6% |
| Interquartile 75% (IQ3) | 2.7% | 4.2% |
| Interquartile Range (IQR) | 0.89% | 1.6% |
| Standard Deviation (Sample) | 0.88% | 1.4% |
| Standard Deviation (Population) | 0.87% | 1.4% |
Similar Demographics by Hearing Disability
Demographics Similar to Immigrants from Venezuela by Hearing Disability
In terms of hearing disability, the demographic groups most similar to Immigrants from Venezuela are Immigrants from Cameroon (2.6%, a difference of 0.14%), Immigrants from Caribbean (2.6%, a difference of 0.16%), Bolivian (2.6%, a difference of 0.23%), Immigrants from Haiti (2.6%, a difference of 0.26%), and Filipino (2.6%, a difference of 0.26%).
| Demographics | Rating | Rank | Hearing Disability |
| Immigrants | El Salvador | 99.7 /100 | #25 | Exceptional 2.6% |
| Immigrants | Senegal | 99.7 /100 | #26 | Exceptional 2.6% |
| Immigrants | South Central Asia | 99.7 /100 | #27 | Exceptional 2.6% |
| Immigrants | Haiti | 99.7 /100 | #28 | Exceptional 2.6% |
| Bolivians | 99.7 /100 | #29 | Exceptional 2.6% |
| Immigrants | Caribbean | 99.7 /100 | #30 | Exceptional 2.6% |
| Immigrants | Cameroon | 99.7 /100 | #31 | Exceptional 2.6% |
| Immigrants | Venezuela | 99.7 /100 | #32 | Exceptional 2.6% |
| Filipinos | 99.6 /100 | #33 | Exceptional 2.6% |
| Immigrants | Pakistan | 99.6 /100 | #34 | Exceptional 2.6% |
| Salvadorans | 99.6 /100 | #35 | Exceptional 2.6% |
| Okinawans | 99.6 /100 | #36 | Exceptional 2.6% |
| Immigrants | Western Africa | 99.6 /100 | #37 | Exceptional 2.6% |
| Immigrants | Jamaica | 99.5 /100 | #38 | Exceptional 2.6% |
| Immigrants | China | 99.5 /100 | #39 | Exceptional 2.6% |
Demographics Similar to Chileans by Hearing Disability
In terms of hearing disability, the demographic groups most similar to Chileans are Immigrants from Syria (2.9%, a difference of 0.0%), Immigrants from Kenya (2.9%, a difference of 0.050%), Ugandan (2.9%, a difference of 0.070%), Immigrants from Vietnam (2.9%, a difference of 0.14%), and Immigrants from Uganda (2.9%, a difference of 0.16%).
| Demographics | Rating | Rank | Hearing Disability |
| Immigrants | Albania | 88.5 /100 | #125 | Excellent 2.9% |
| Immigrants | Sudan | 87.8 /100 | #126 | Excellent 2.9% |
| South American Indians | 86.9 /100 | #127 | Excellent 2.9% |
| Immigrants | Western Asia | 86.9 /100 | #128 | Excellent 2.9% |
| Immigrants | Uganda | 86.6 /100 | #129 | Excellent 2.9% |
| Immigrants | Vietnam | 86.5 /100 | #130 | Excellent 2.9% |
| Immigrants | Kenya | 86.1 /100 | #131 | Excellent 2.9% |
| Chileans | 85.8 /100 | #132 | Excellent 2.9% |
| Immigrants | Syria | 85.8 /100 | #133 | Excellent 2.9% |
| Ugandans | 85.5 /100 | #134 | Excellent 2.9% |
| Soviet Union | 84.8 /100 | #135 | Excellent 2.9% |
| Immigrants | Brazil | 84.6 /100 | #136 | Excellent 2.9% |
| Sri Lankans | 84.1 /100 | #137 | Excellent 2.9% |
| Immigrants | Costa Rica | 84.0 /100 | #138 | Excellent 2.9% |
| Bermudans | 83.8 /100 | #139 | Excellent 2.9% |