Comanche vs Jamaican Disability Age 35 to 64
COMPARE
Comanche
Jamaican
Disability Age 35 to 64
Disability Age 35 to 64 Comparison
Comanche
Jamaicans
14.7%
DISABILITY AGE 35 TO 64
0.0/ 100
METRIC RATING
321st/ 347
METRIC RANK
11.9%
DISABILITY AGE 35 TO 64
5.7/ 100
METRIC RATING
231st/ 347
METRIC RANK
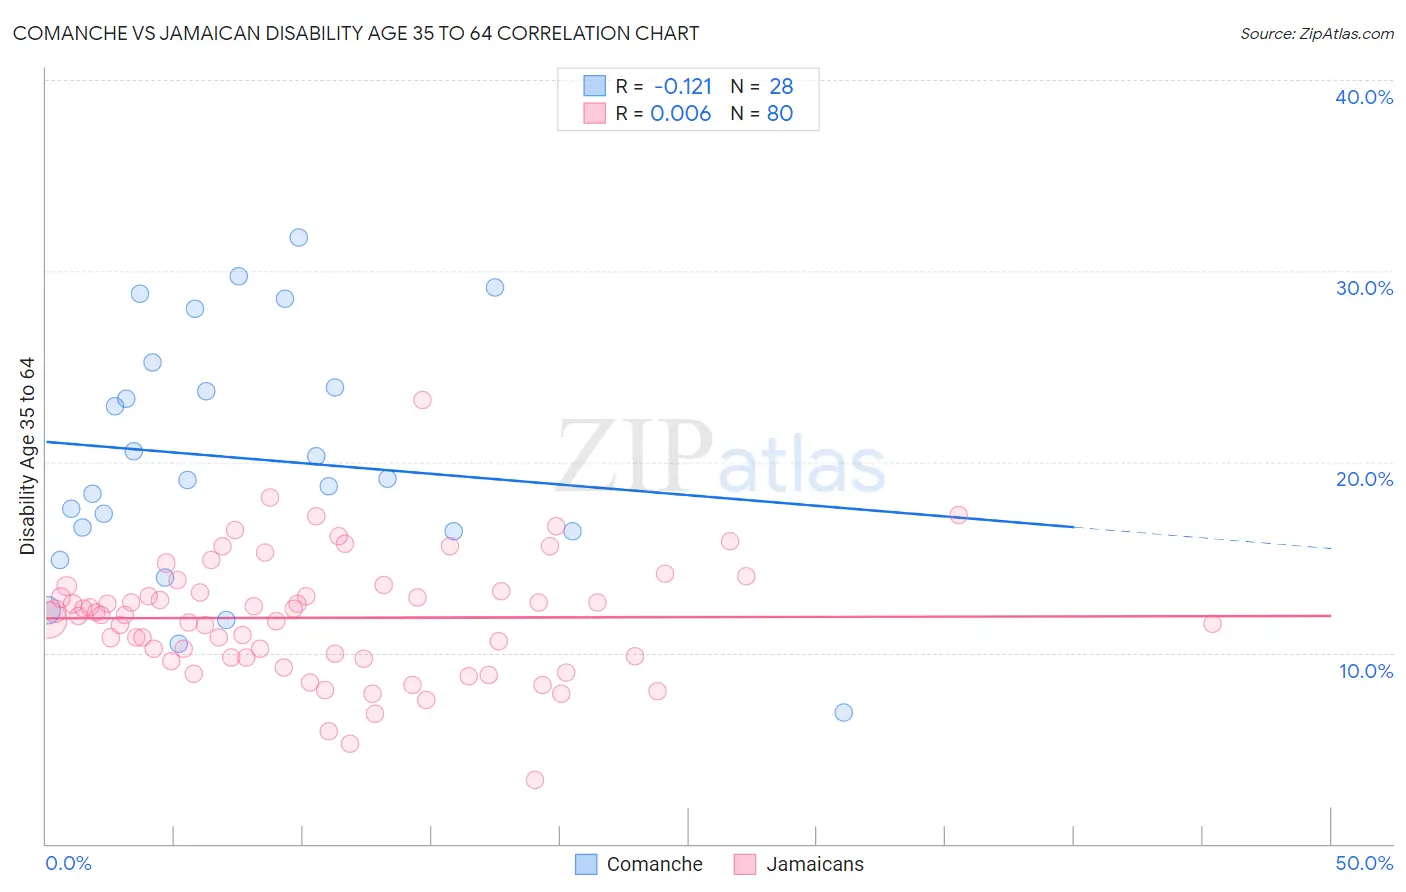
Comanche vs Jamaican Disability Age 35 to 64 Correlation Chart
The statistical analysis conducted on geographies consisting of 109,769,309 people shows a poor negative correlation between the proportion of Comanche and percentage of population with a disability between the ages 34 and 64 in the United States with a correlation coefficient (R) of -0.121 and weighted average of 14.7%. Similarly, the statistical analysis conducted on geographies consisting of 367,594,388 people shows no correlation between the proportion of Jamaicans and percentage of population with a disability between the ages 34 and 64 in the United States with a correlation coefficient (R) of 0.006 and weighted average of 11.9%, a difference of 23.9%.
Disability Age 35 to 64 Correlation Summary
| Measurement | Comanche | Jamaican |
| Minimum | 6.9% | 3.4% |
| Maximum | 31.7% | 23.2% |
| Range | 24.8% | 19.9% |
| Mean | 20.2% | 11.8% |
| Median | 19.1% | 12.0% |
| Interquartile 25% (IQ1) | 16.4% | 9.7% |
| Interquartile 75% (IQ3) | 24.6% | 13.3% |
| Interquartile Range (IQR) | 8.2% | 3.6% |
| Standard Deviation (Sample) | 6.4% | 3.2% |
| Standard Deviation (Population) | 6.3% | 3.2% |
Similar Demographics by Disability Age 35 to 64
Demographics Similar to Comanche by Disability Age 35 to 64
In terms of disability age 35 to 64, the demographic groups most similar to Comanche are Potawatomi (14.8%, a difference of 0.040%), Black/African American (14.7%, a difference of 0.26%), Immigrants from Cabo Verde (14.7%, a difference of 0.41%), Ottawa (14.6%, a difference of 0.83%), and Crow (14.6%, a difference of 0.90%).
| Demographics | Rating | Rank | Disability Age 35 to 64 |
| Shoshone | 0.0 /100 | #314 | Tragic 14.5% |
| Alaska Natives | 0.0 /100 | #315 | Tragic 14.5% |
| Osage | 0.0 /100 | #316 | Tragic 14.5% |
| Crow | 0.0 /100 | #317 | Tragic 14.6% |
| Ottawa | 0.0 /100 | #318 | Tragic 14.6% |
| Immigrants | Cabo Verde | 0.0 /100 | #319 | Tragic 14.7% |
| Blacks/African Americans | 0.0 /100 | #320 | Tragic 14.7% |
| Comanche | 0.0 /100 | #321 | Tragic 14.7% |
| Potawatomi | 0.0 /100 | #322 | Tragic 14.8% |
| Apache | 0.0 /100 | #323 | Tragic 14.9% |
| Chippewa | 0.0 /100 | #324 | Tragic 15.0% |
| Arapaho | 0.0 /100 | #325 | Tragic 15.1% |
| Natives/Alaskans | 0.0 /100 | #326 | Tragic 15.3% |
| Pueblo | 0.0 /100 | #327 | Tragic 15.3% |
| Cajuns | 0.0 /100 | #328 | Tragic 15.3% |
Demographics Similar to Jamaicans by Disability Age 35 to 64
In terms of disability age 35 to 64, the demographic groups most similar to Jamaicans are Panamanian (11.9%, a difference of 0.030%), British West Indian (11.9%, a difference of 0.13%), Sudanese (11.9%, a difference of 0.14%), Immigrants from Germany (11.9%, a difference of 0.15%), and Immigrants from Central America (11.9%, a difference of 0.19%).
| Demographics | Rating | Rank | Disability Age 35 to 64 |
| Immigrants | Ghana | 7.8 /100 | #224 | Tragic 11.8% |
| Immigrants | Belize | 6.6 /100 | #225 | Tragic 11.9% |
| Scandinavians | 6.4 /100 | #226 | Tragic 11.9% |
| Immigrants | Central America | 6.3 /100 | #227 | Tragic 11.9% |
| Immigrants | Germany | 6.2 /100 | #228 | Tragic 11.9% |
| British West Indians | 6.1 /100 | #229 | Tragic 11.9% |
| Panamanians | 5.8 /100 | #230 | Tragic 11.9% |
| Jamaicans | 5.7 /100 | #231 | Tragic 11.9% |
| Sudanese | 5.3 /100 | #232 | Tragic 11.9% |
| Bermudans | 5.0 /100 | #233 | Tragic 11.9% |
| Portuguese | 4.9 /100 | #234 | Tragic 11.9% |
| Belizeans | 4.5 /100 | #235 | Tragic 12.0% |
| Immigrants | Middle Africa | 4.5 /100 | #236 | Tragic 12.0% |
| Immigrants | Cambodia | 3.9 /100 | #237 | Tragic 12.0% |
| West Indians | 3.7 /100 | #238 | Tragic 12.0% |