Sudanese vs Nicaraguan Disability Age 35 to 64
COMPARE
Sudanese
Nicaraguan
Disability Age 35 to 64
Disability Age 35 to 64 Comparison
Sudanese
Nicaraguans
11.9%
DISABILITY AGE 35 TO 64
5.3/ 100
METRIC RATING
232nd/ 347
METRIC RANK
10.2%
DISABILITY AGE 35 TO 64
99.1/ 100
METRIC RATING
87th/ 347
METRIC RANK
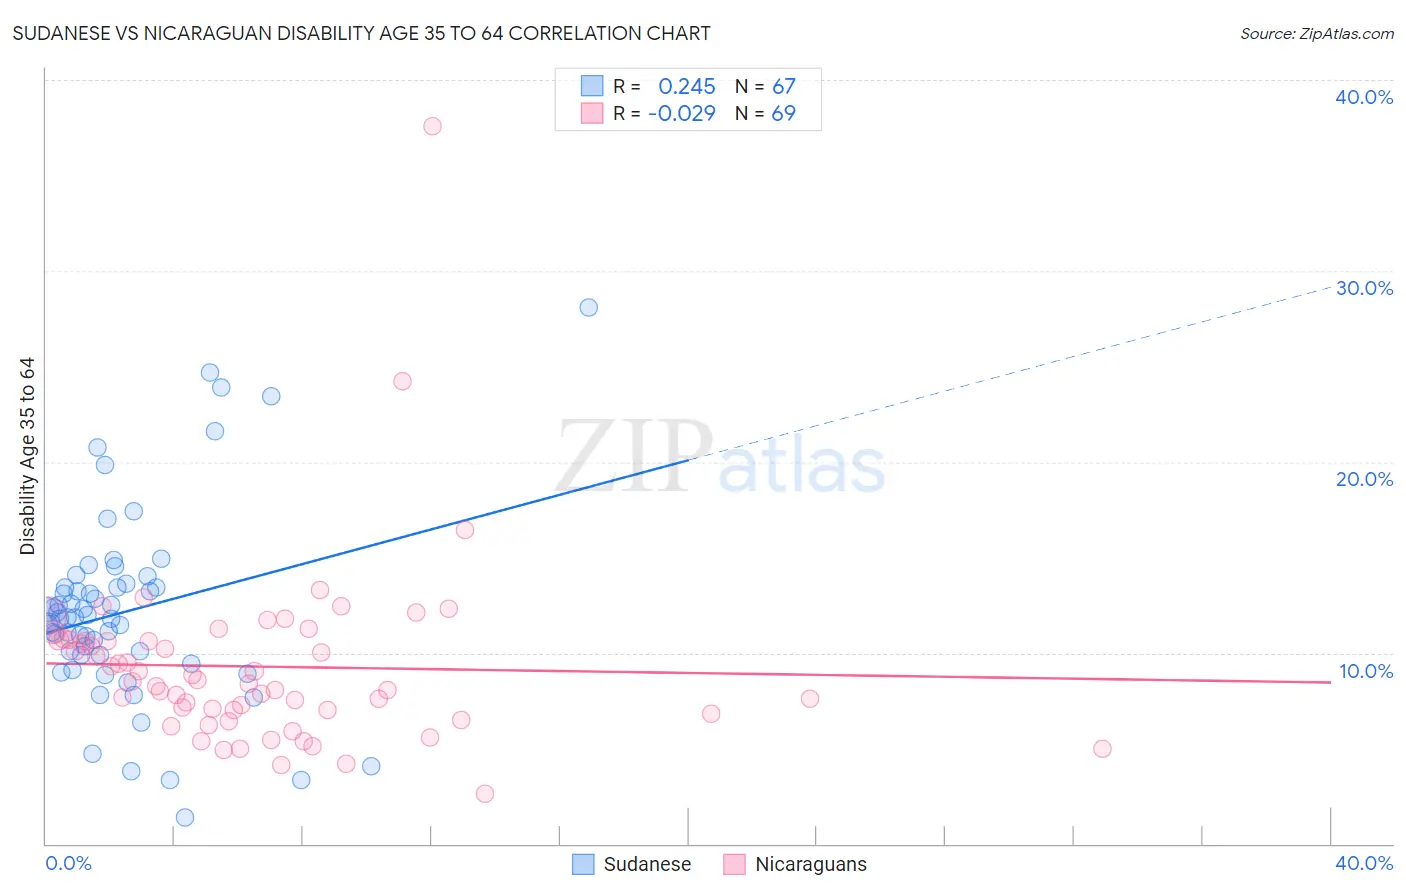
Sudanese vs Nicaraguan Disability Age 35 to 64 Correlation Chart
The statistical analysis conducted on geographies consisting of 110,102,872 people shows a weak positive correlation between the proportion of Sudanese and percentage of population with a disability between the ages 34 and 64 in the United States with a correlation coefficient (R) of 0.245 and weighted average of 11.9%. Similarly, the statistical analysis conducted on geographies consisting of 285,605,152 people shows no correlation between the proportion of Nicaraguans and percentage of population with a disability between the ages 34 and 64 in the United States with a correlation coefficient (R) of -0.029 and weighted average of 10.2%, a difference of 16.7%.
Disability Age 35 to 64 Correlation Summary
| Measurement | Sudanese | Nicaraguan |
| Minimum | 1.4% | 2.6% |
| Maximum | 28.1% | 37.6% |
| Range | 26.7% | 35.0% |
| Mean | 12.2% | 9.3% |
| Median | 11.9% | 8.5% |
| Interquartile 25% (IQ1) | 9.9% | 6.9% |
| Interquartile 75% (IQ3) | 13.4% | 10.7% |
| Interquartile Range (IQR) | 3.5% | 3.8% |
| Standard Deviation (Sample) | 5.0% | 4.7% |
| Standard Deviation (Population) | 5.0% | 4.7% |
Similar Demographics by Disability Age 35 to 64
Demographics Similar to Sudanese by Disability Age 35 to 64
In terms of disability age 35 to 64, the demographic groups most similar to Sudanese are Bermudan (11.9%, a difference of 0.11%), Jamaican (11.9%, a difference of 0.14%), Panamanian (11.9%, a difference of 0.17%), Portuguese (11.9%, a difference of 0.18%), and British West Indian (11.9%, a difference of 0.27%).
| Demographics | Rating | Rank | Disability Age 35 to 64 |
| Immigrants | Belize | 6.6 /100 | #225 | Tragic 11.9% |
| Scandinavians | 6.4 /100 | #226 | Tragic 11.9% |
| Immigrants | Central America | 6.3 /100 | #227 | Tragic 11.9% |
| Immigrants | Germany | 6.2 /100 | #228 | Tragic 11.9% |
| British West Indians | 6.1 /100 | #229 | Tragic 11.9% |
| Panamanians | 5.8 /100 | #230 | Tragic 11.9% |
| Jamaicans | 5.7 /100 | #231 | Tragic 11.9% |
| Sudanese | 5.3 /100 | #232 | Tragic 11.9% |
| Bermudans | 5.0 /100 | #233 | Tragic 11.9% |
| Portuguese | 4.9 /100 | #234 | Tragic 11.9% |
| Belizeans | 4.5 /100 | #235 | Tragic 12.0% |
| Immigrants | Middle Africa | 4.5 /100 | #236 | Tragic 12.0% |
| Immigrants | Cambodia | 3.9 /100 | #237 | Tragic 12.0% |
| West Indians | 3.7 /100 | #238 | Tragic 12.0% |
| Immigrants | Western Africa | 3.3 /100 | #239 | Tragic 12.0% |
Demographics Similar to Nicaraguans by Disability Age 35 to 64
In terms of disability age 35 to 64, the demographic groups most similar to Nicaraguans are Immigrants from Europe (10.2%, a difference of 0.0%), Immigrants from Kuwait (10.2%, a difference of 0.080%), Chilean (10.2%, a difference of 0.23%), Uruguayan (10.2%, a difference of 0.25%), and Sri Lankan (10.2%, a difference of 0.29%).
| Demographics | Rating | Rank | Disability Age 35 to 64 |
| Immigrants | Croatia | 99.3 /100 | #80 | Exceptional 10.2% |
| Latvians | 99.2 /100 | #81 | Exceptional 10.2% |
| Russians | 99.2 /100 | #82 | Exceptional 10.2% |
| Immigrants | Brazil | 99.2 /100 | #83 | Exceptional 10.2% |
| Sri Lankans | 99.2 /100 | #84 | Exceptional 10.2% |
| Immigrants | Kuwait | 99.1 /100 | #85 | Exceptional 10.2% |
| Immigrants | Europe | 99.1 /100 | #86 | Exceptional 10.2% |
| Nicaraguans | 99.1 /100 | #87 | Exceptional 10.2% |
| Chileans | 99.0 /100 | #88 | Exceptional 10.2% |
| Uruguayans | 99.0 /100 | #89 | Exceptional 10.2% |
| Afghans | 98.9 /100 | #90 | Exceptional 10.3% |
| Immigrants | Lebanon | 98.9 /100 | #91 | Exceptional 10.3% |
| Immigrants | Northern Africa | 98.7 /100 | #92 | Exceptional 10.3% |
| Immigrants | North Macedonia | 98.7 /100 | #93 | Exceptional 10.3% |
| Immigrants | Italy | 98.7 /100 | #94 | Exceptional 10.3% |