Cuban vs Jamaican Disability Age 35 to 64

COMPARE

Cuban
Race
Ancestry
AfghanAfricanAlaska NativeAlaskan AthabascanAlbanianAleutAlsatianAmericanApacheArabArapahoArgentineanArmenianAssyrian/Chaldean/SyriacAustralianAustrianBahamianBangladeshiBarbadianBasqueBelgianBelizeanBermudanBhutaneseBlackfeetBolivianBrazilianBritishBritish West IndianBulgarianBurmeseCajunCambodianCanadianCape VerdeanCarpatho RusynCelticCentral AmericanCentral American IndianCherokeeCheyenneChickasawChileanChineseChippewaChoctawColombianColvilleComancheCosta RicanCreeCreekCroatianCrowCubanCypriotCzechCzechoslovakianDanishDelawareDominicanDutchDutch West IndianEastern EuropeanEcuadorianEgyptianEnglishEstonianEthiopianEuropeanFijianFilipinoFinnishFrenchFrench American IndianFrench CanadianGermanGerman RussianGhanaianGreekGuamanian/ChamorroGuatemalanGuyaneseHaitianHmongHonduranHopiHoumaHungarianIcelanderIndian (Asian)IndonesianInupiatIranianIraqiIrishIroquoisIsraeliItalianJapaneseJordanianKenyanKiowaKoreanLaotianLatvianLebaneseLiberianLithuanianLumbeeLuxembourgerMacedonianMalaysianMalteseMarshalleseMenomineeMexicanMexican American IndianMongolianMoroccanNative HawaiianNavajoNepaleseNew ZealanderNicaraguanNigerianNorthern EuropeanNorwegianOkinawanOsageOttawaPaiutePakistaniPalestinianPanamanianParaguayanPennsylvania GermanPeruvianPimaPolishPortuguesePotawatomiPuebloPuerto RicanPuget Sound SalishRomanianRussianSalvadoranSamoanScandinavianScotch-IrishScottishSeminoleSenegaleseSerbianShoshoneSierra LeoneanSiouxSlavicSlovakSloveneSomaliSouth AfricanSouth AmericanSouth American IndianSoviet UnionSpaniardSpanishSpanish AmericanSpanish American IndianSri LankanSubsaharan AfricanSudaneseSwedishSwissSyrianTaiwaneseThaiTlingit-HaidaTohono O'OdhamTonganTrinidadian and TobagonianTsimshianTurkishU.S. Virgin IslanderUgandanUkrainianUruguayanUteVenezuelanVietnameseWelshWest IndianYakamaYaquiYugoslavianYumanYup'ikZimbabwean
Immigration
NonimmigrantsImmigrantsAfghanistanAfricaAlbaniaArgentinaArmeniaAsiaAustraliaAustriaBahamasBangladeshBarbadosBelarusBelgiumBelizeBoliviaBosnia and HerzegovinaBrazilBulgariaBurma/MyanmarCabo VerdeCambodiaCameroonCanadaCaribbeanCentral AmericaChileChinaColombiaCongoCosta RicaCroatiaCubaCzechoslovakiaDenmarkDominicaDominican RepublicEastern AfricaEastern AsiaEastern EuropeEcuadorEgyptEl SalvadorEnglandEritreaEthiopiaEuropeFijiFranceGermanyGhanaGreeceGrenadaGuatemalaGuyanaHaitiHondurasHong KongHungaryIndiaIndonesiaIranIraqIrelandIsraelItalyJamaicaJapanJordanKazakhstanKenyaKoreaKuwaitLaosLatin AmericaLatviaLebanonLiberiaLithuaniaMalaysiaMexicoMicronesiaMiddle AfricaMoldovaMoroccoNepalNetherlandsNicaraguaNigeriaNorth AmericaNorth MacedoniaNorthern AfricaNorthern EuropeNorwayOceaniaPakistanPanamaPeruPhilippinesPolandPortugalRomaniaRussiaSaudi ArabiaScotlandSenegalSerbiaSierra LeoneSingaporeSomaliaSouth AfricaSouth AmericaSouth Central AsiaSouth Eastern AsiaSouthern EuropeSpainSri LankaSt. Vincent and the GrenadinesSudanSwedenSwitzerlandSyriaTaiwanThailandTrinidad and TobagoTurkeyUgandaUkraineUruguayUzbekistanVenezuelaVietnamWest IndiesWestern AfricaWestern AsiaWestern EuropeYemenZaireZimbabweAzores
Jamaican
Race
Ancestry
AfghanAfricanAlaska NativeAlaskan AthabascanAlbanianAleutAlsatianAmericanApacheArabArapahoArgentineanArmenianAssyrian/Chaldean/SyriacAustralianAustrianBahamianBangladeshiBarbadianBasqueBelgianBelizeanBermudanBhutaneseBlackfeetBolivianBrazilianBritishBritish West IndianBulgarianBurmeseCajunCambodianCanadianCape VerdeanCarpatho RusynCelticCentral AmericanCentral American IndianCherokeeCheyenneChickasawChileanChineseChippewaChoctawColombianColvilleComancheCosta RicanCreeCreekCroatianCrowCypriotCzechCzechoslovakianDanishDelawareDominicanDutchDutch West IndianEastern EuropeanEcuadorianEgyptianEnglishEstonianEthiopianEuropeanFijianFilipinoFinnishFrenchFrench American IndianFrench CanadianGermanGerman RussianGhanaianGreekGuamanian/ChamorroGuatemalanGuyaneseHaitianHmongHonduranHopiHoumaHungarianIcelanderIndian (Asian)IndonesianInupiatIranianIraqiIrishIroquoisIsraeliItalianJamaicanJapaneseJordanianKenyanKiowaKoreanLaotianLatvianLebaneseLiberianLithuanianLumbeeLuxembourgerMacedonianMalaysianMalteseMarshalleseMenomineeMexicanMexican American IndianMongolianMoroccanNative HawaiianNavajoNepaleseNew ZealanderNicaraguanNigerianNorthern EuropeanNorwegianOkinawanOsageOttawaPaiutePakistaniPalestinianPanamanianParaguayanPennsylvania GermanPeruvianPimaPolishPortuguesePotawatomiPuebloPuerto RicanPuget Sound SalishRomanianRussianSalvadoranSamoanScandinavianScotch-IrishScottishSeminoleSenegaleseSerbianShoshoneSierra LeoneanSiouxSlavicSlovakSloveneSomaliSouth AfricanSouth AmericanSouth American IndianSoviet UnionSpaniardSpanishSpanish AmericanSpanish American IndianSri LankanSubsaharan AfricanSudaneseSwedishSwissSyrianTaiwaneseThaiTlingit-HaidaTohono O'OdhamTonganTrinidadian and TobagonianTsimshianTurkishU.S. Virgin IslanderUgandanUkrainianUruguayanUteVenezuelanVietnameseWelshWest IndianYakamaYaquiYugoslavianYumanYup'ikZimbabwean
Immigration
NonimmigrantsImmigrantsAfghanistanAfricaAlbaniaArgentinaArmeniaAsiaAustraliaAustriaBahamasBangladeshBarbadosBelarusBelgiumBelizeBoliviaBosnia and HerzegovinaBrazilBulgariaBurma/MyanmarCabo VerdeCambodiaCameroonCanadaCaribbeanCentral AmericaChileChinaColombiaCongoCosta RicaCroatiaCubaCzechoslovakiaDenmarkDominicaDominican RepublicEastern AfricaEastern AsiaEastern EuropeEcuadorEgyptEl SalvadorEnglandEritreaEthiopiaEuropeFijiFranceGermanyGhanaGreeceGrenadaGuatemalaGuyanaHaitiHondurasHong KongHungaryIndiaIndonesiaIranIraqIrelandIsraelItalyJamaicaJapanJordanKazakhstanKenyaKoreaKuwaitLaosLatin AmericaLatviaLebanonLiberiaLithuaniaMalaysiaMexicoMicronesiaMiddle AfricaMoldovaMoroccoNepalNetherlandsNicaraguaNigeriaNorth AmericaNorth MacedoniaNorthern AfricaNorthern EuropeNorwayOceaniaPakistanPanamaPeruPhilippinesPolandPortugalRomaniaRussiaSaudi ArabiaScotlandSenegalSerbiaSierra LeoneSingaporeSomaliaSouth AfricaSouth AmericaSouth Central AsiaSouth Eastern AsiaSouthern EuropeSpainSri LankaSt. Vincent and the GrenadinesSudanSwedenSwitzerlandSyriaTaiwanThailandTrinidad and TobagoTurkeyUgandaUkraineUruguayUzbekistanVenezuelaVietnamWest IndiesWestern AfricaWestern AsiaWestern EuropeYemenZaireZimbabweAzores
Disability Age 35 to 64
Income
Poverty
Unemployment
Labor Participation
Family Structure
Vehicle Availability
Education Level
Disability

Disability Age 35 to 64 Comparison

Cubans

Jamaicans

Exceptional
Tragic
10.0%
DISABILITY AGE 35 TO 64
99.6/ 100
METRIC RATING
66th/ 347
METRIC RANK
11.9%
DISABILITY AGE 35 TO 64
5.7/ 100
METRIC RATING
231st/ 347
METRIC RANK

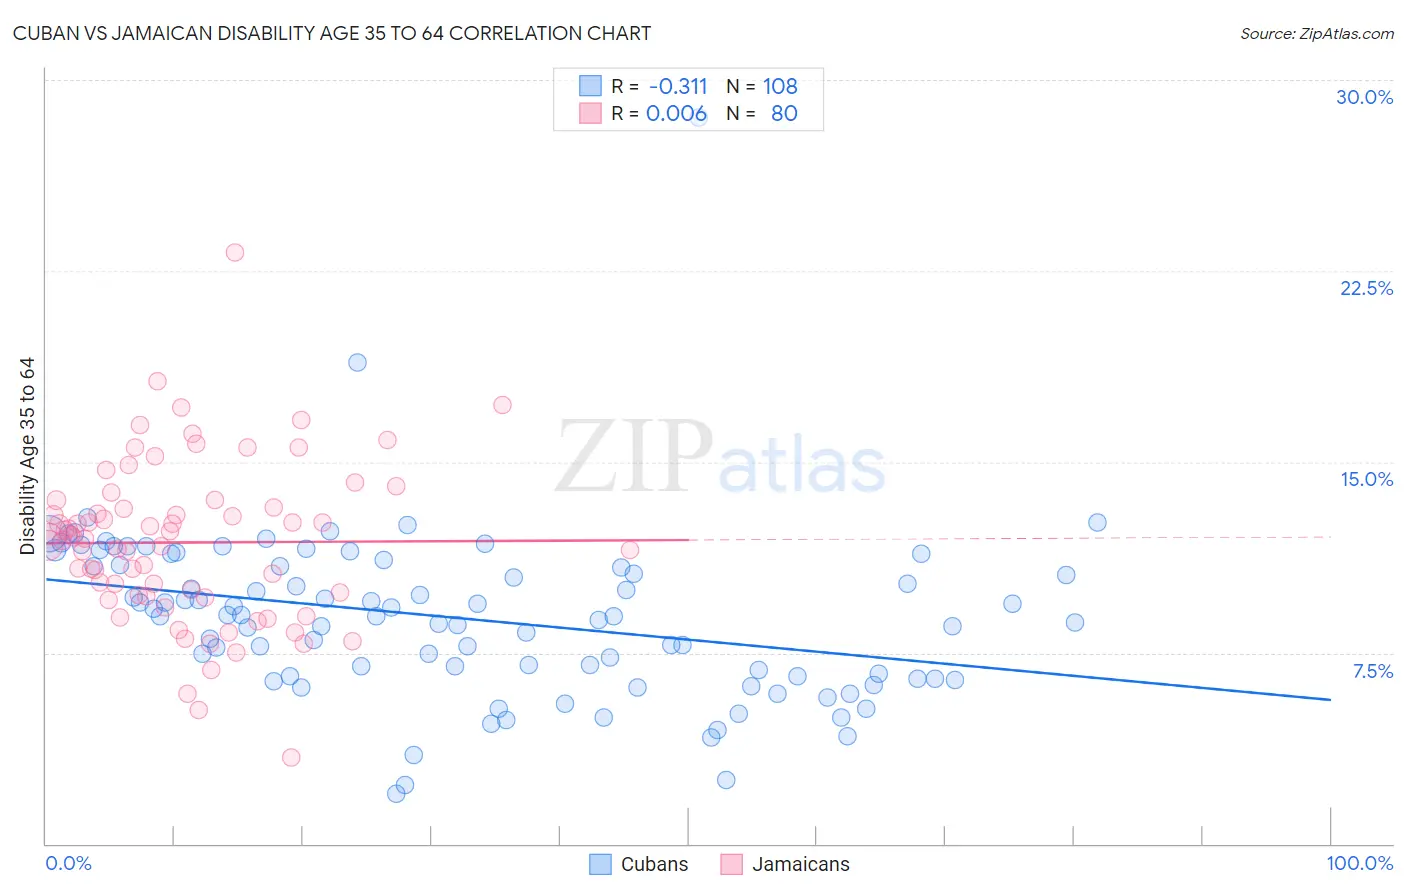
Cuban vs Jamaican Disability Age 35 to 64 Correlation Chart

The statistical analysis conducted on geographies consisting of 448,900,102 people shows a mild negative correlation between the proportion of Cubans and percentage of population with a disability between the ages 34 and 64 in the United States with a correlation coefficient (R) of -0.311 and weighted average of 10.0%. Similarly, the statistical analysis conducted on geographies consisting of 367,594,388 people shows no correlation between the proportion of Jamaicans and percentage of population with a disability between the ages 34 and 64 in the United States with a correlation coefficient (R) of 0.006 and weighted average of 11.9%, a difference of 18.8%.
Cuban vs Jamaican Disability Age 35 to 64

Disability Age 35 to 64 Correlation Summary

MeasurementCubanJamaican
Minimum2.0%3.4%
Maximum28.5%23.2%
Range26.6%19.9%
Mean8.9%11.8%
Median9.0%12.0%
Interquartile 25% (IQ1)6.6%9.7%
Interquartile 75% (IQ3)10.9%13.3%
Interquartile Range (IQR)4.4%3.6%
Standard Deviation (Sample)3.4%3.2%
Standard Deviation (Population)3.3%3.2%

Similar Demographics by Disability Age 35 to 64

Demographics Similar to Cubans by Disability Age 35 to 64

In terms of disability age 35 to 64, the demographic groups most similar to Cubans are Immigrants from Poland (10.0%, a difference of 0.24%), Immigrants from Romania (10.0%, a difference of 0.32%), Immigrants from Uzbekistan (10.1%, a difference of 0.35%), Immigrants from Switzerland (10.1%, a difference of 0.46%), and Immigrants from Eastern Europe (10.1%, a difference of 0.47%).
DemographicsRating | RankDisability Age 35 to 64
Immigrants | Sweden
99.7
/100
|
#59
Exceptional
9.9%
Immigrants | South America
99.7
/100
|
#60
Exceptional
9.9%
Immigrants | Spain
99.7
/100
|
#61
Exceptional
10.0%
Eastern Europeans
99.7
/100
|
#62
Exceptional
10.0%
Immigrants | Czechoslovakia
99.7
/100
|
#63
Exceptional
10.0%
Immigrants | Romania
99.7
/100
|
#64
Exceptional
10.0%
Immigrants | Poland
99.6
/100
|
#65
Exceptional
10.0%
Cubans
99.6
/100
|
#66
Exceptional
10.0%
Immigrants | Uzbekistan
99.5
/100
|
#67
Exceptional
10.1%
Immigrants | Switzerland
99.5
/100
|
#68
Exceptional
10.1%
Immigrants | Eastern Europe
99.5
/100
|
#69
Exceptional
10.1%
Immigrants | Nicaragua
99.5
/100
|
#70
Exceptional
10.1%
Immigrants | Kazakhstan
99.5
/100
|
#71
Exceptional
10.1%
Immigrants | Northern Europe
99.5
/100
|
#72
Exceptional
10.1%
Immigrants | France
99.5
/100
|
#73
Exceptional
10.1%

Demographics Similar to Jamaicans by Disability Age 35 to 64

In terms of disability age 35 to 64, the demographic groups most similar to Jamaicans are Panamanian (11.9%, a difference of 0.030%), British West Indian (11.9%, a difference of 0.13%), Sudanese (11.9%, a difference of 0.14%), Immigrants from Germany (11.9%, a difference of 0.15%), and Immigrants from Central America (11.9%, a difference of 0.19%).
DemographicsRating | RankDisability Age 35 to 64
Immigrants | Ghana
7.8
/100
|
#224
Tragic
11.8%
Immigrants | Belize
6.6
/100
|
#225
Tragic
11.9%
Scandinavians
6.4
/100
|
#226
Tragic
11.9%
Immigrants | Central America
6.3
/100
|
#227
Tragic
11.9%
Immigrants | Germany
6.2
/100
|
#228
Tragic
11.9%
British West Indians
6.1
/100
|
#229
Tragic
11.9%
Panamanians
5.8
/100
|
#230
Tragic
11.9%
Jamaicans
5.7
/100
|
#231
Tragic
11.9%
Sudanese
5.3
/100
|
#232
Tragic
11.9%
Bermudans
5.0
/100
|
#233
Tragic
11.9%
Portuguese
4.9
/100
|
#234
Tragic
11.9%
Belizeans
4.5
/100
|
#235
Tragic
12.0%
Immigrants | Middle Africa
4.5
/100
|
#236
Tragic
12.0%
Immigrants | Cambodia
3.9
/100
|
#237
Tragic
12.0%
West Indians
3.7
/100
|
#238
Tragic
12.0%