Sudanese vs Cajun Ambulatory Disability
COMPARE
Sudanese
Cajun
Ambulatory Disability
Ambulatory Disability Comparison
Sudanese
Cajuns
5.7%
AMBULATORY DISABILITY
99.3/ 100
METRIC RATING
76th/ 347
METRIC RANK
7.8%
AMBULATORY DISABILITY
0.0/ 100
METRIC RATING
331st/ 347
METRIC RANK
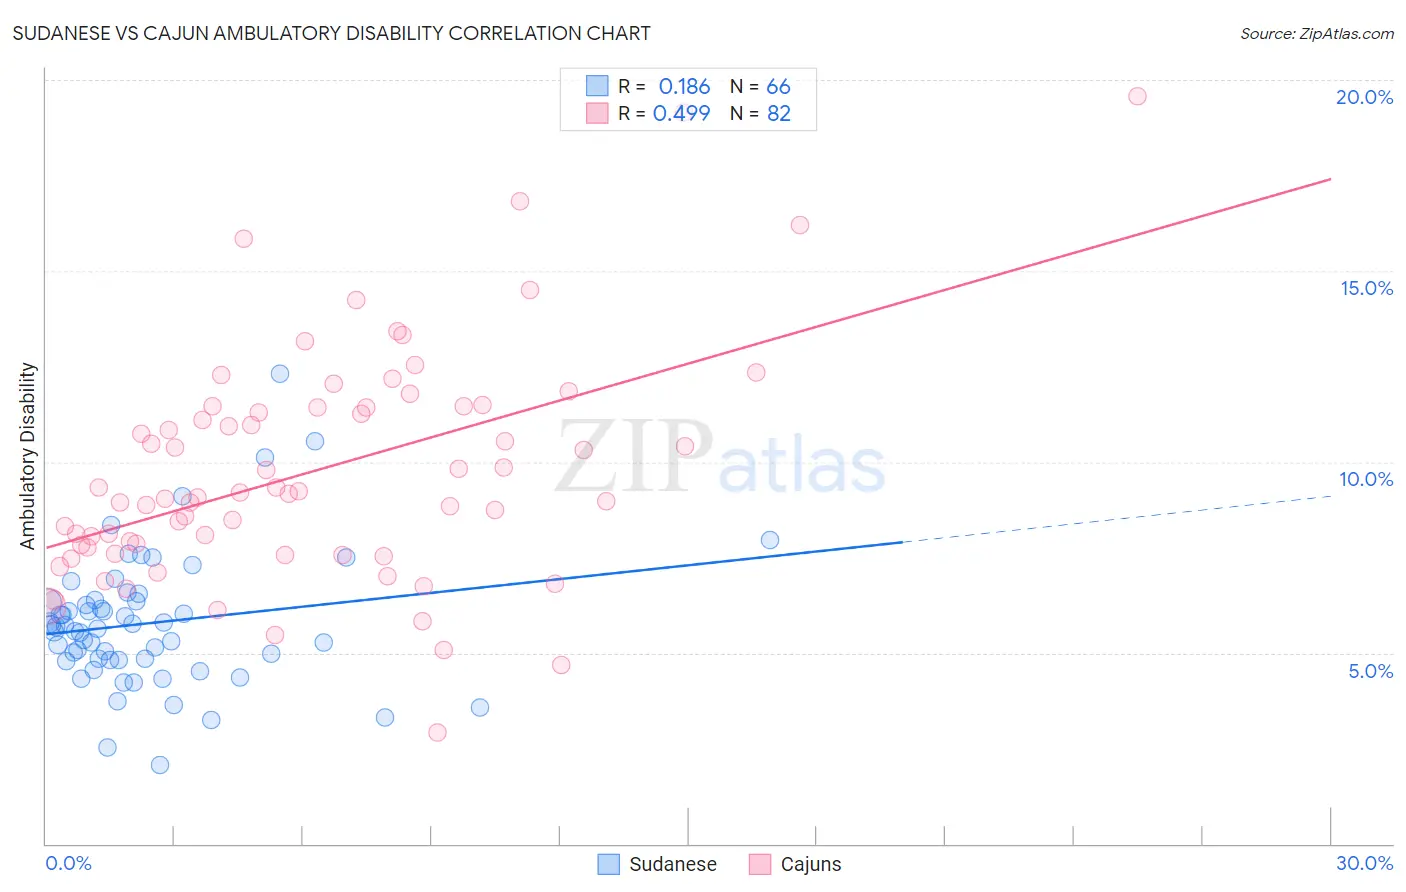
Sudanese vs Cajun Ambulatory Disability Correlation Chart
The statistical analysis conducted on geographies consisting of 110,129,493 people shows a poor positive correlation between the proportion of Sudanese and percentage of population with ambulatory disability in the United States with a correlation coefficient (R) of 0.186 and weighted average of 5.7%. Similarly, the statistical analysis conducted on geographies consisting of 149,692,949 people shows a moderate positive correlation between the proportion of Cajuns and percentage of population with ambulatory disability in the United States with a correlation coefficient (R) of 0.499 and weighted average of 7.8%, a difference of 36.2%.
Ambulatory Disability Correlation Summary
| Measurement | Sudanese | Cajun |
| Minimum | 2.1% | 2.9% |
| Maximum | 12.3% | 19.6% |
| Range | 10.2% | 16.7% |
| Mean | 5.8% | 9.8% |
| Median | 5.6% | 9.2% |
| Interquartile 25% (IQ1) | 4.8% | 7.7% |
| Interquartile 75% (IQ3) | 6.3% | 11.4% |
| Interquartile Range (IQR) | 1.5% | 3.7% |
| Standard Deviation (Sample) | 1.8% | 3.0% |
| Standard Deviation (Population) | 1.7% | 3.0% |
Similar Demographics by Ambulatory Disability
Demographics Similar to Sudanese by Ambulatory Disability
In terms of ambulatory disability, the demographic groups most similar to Sudanese are Immigrants from South Africa (5.7%, a difference of 0.020%), Immigrants from Cameroon (5.7%, a difference of 0.070%), Immigrants from Northern Africa (5.7%, a difference of 0.080%), Brazilian (5.7%, a difference of 0.090%), and Immigrants from Peru (5.7%, a difference of 0.12%).
| Demographics | Rating | Rank | Ambulatory Disability |
| Peruvians | 99.5 /100 | #69 | Exceptional 5.7% |
| Sierra Leoneans | 99.4 /100 | #70 | Exceptional 5.7% |
| Immigrants | Peru | 99.4 /100 | #71 | Exceptional 5.7% |
| Brazilians | 99.4 /100 | #72 | Exceptional 5.7% |
| Immigrants | Northern Africa | 99.4 /100 | #73 | Exceptional 5.7% |
| Immigrants | Cameroon | 99.4 /100 | #74 | Exceptional 5.7% |
| Immigrants | South Africa | 99.3 /100 | #75 | Exceptional 5.7% |
| Sudanese | 99.3 /100 | #76 | Exceptional 5.7% |
| Immigrants | Vietnam | 99.3 /100 | #77 | Exceptional 5.7% |
| Somalis | 99.2 /100 | #78 | Exceptional 5.7% |
| Chileans | 99.2 /100 | #79 | Exceptional 5.7% |
| Immigrants | Ireland | 99.2 /100 | #80 | Exceptional 5.7% |
| Immigrants | Jordan | 99.2 /100 | #81 | Exceptional 5.7% |
| Palestinians | 99.2 /100 | #82 | Exceptional 5.7% |
| Eastern Europeans | 99.2 /100 | #83 | Exceptional 5.7% |
Demographics Similar to Cajuns by Ambulatory Disability
In terms of ambulatory disability, the demographic groups most similar to Cajuns are Menominee (7.8%, a difference of 0.28%), Cherokee (7.9%, a difference of 1.2%), Paiute (7.7%, a difference of 1.2%), Yuman (7.9%, a difference of 2.1%), and Pueblo (7.6%, a difference of 2.5%).
| Demographics | Rating | Rank | Ambulatory Disability |
| Navajo | 0.0 /100 | #324 | Tragic 7.5% |
| Comanche | 0.0 /100 | #325 | Tragic 7.5% |
| Blacks/African Americans | 0.0 /100 | #326 | Tragic 7.5% |
| Natives/Alaskans | 0.0 /100 | #327 | Tragic 7.5% |
| Hopi | 0.0 /100 | #328 | Tragic 7.6% |
| Pueblo | 0.0 /100 | #329 | Tragic 7.6% |
| Paiute | 0.0 /100 | #330 | Tragic 7.7% |
| Cajuns | 0.0 /100 | #331 | Tragic 7.8% |
| Menominee | 0.0 /100 | #332 | Tragic 7.8% |
| Cherokee | 0.0 /100 | #333 | Tragic 7.9% |
| Yuman | 0.0 /100 | #334 | Tragic 7.9% |
| Chickasaw | 0.0 /100 | #335 | Tragic 8.0% |
| Seminole | 0.0 /100 | #336 | Tragic 8.0% |
| Dutch West Indians | 0.0 /100 | #337 | Tragic 8.2% |
| Colville | 0.0 /100 | #338 | Tragic 8.2% |