Sudanese vs British Ambulatory Disability
COMPARE
Sudanese
British
Ambulatory Disability
Ambulatory Disability Comparison
Sudanese
British
5.7%
AMBULATORY DISABILITY
99.3/ 100
METRIC RATING
76th/ 347
METRIC RANK
6.2%
AMBULATORY DISABILITY
34.3/ 100
METRIC RATING
188th/ 347
METRIC RANK
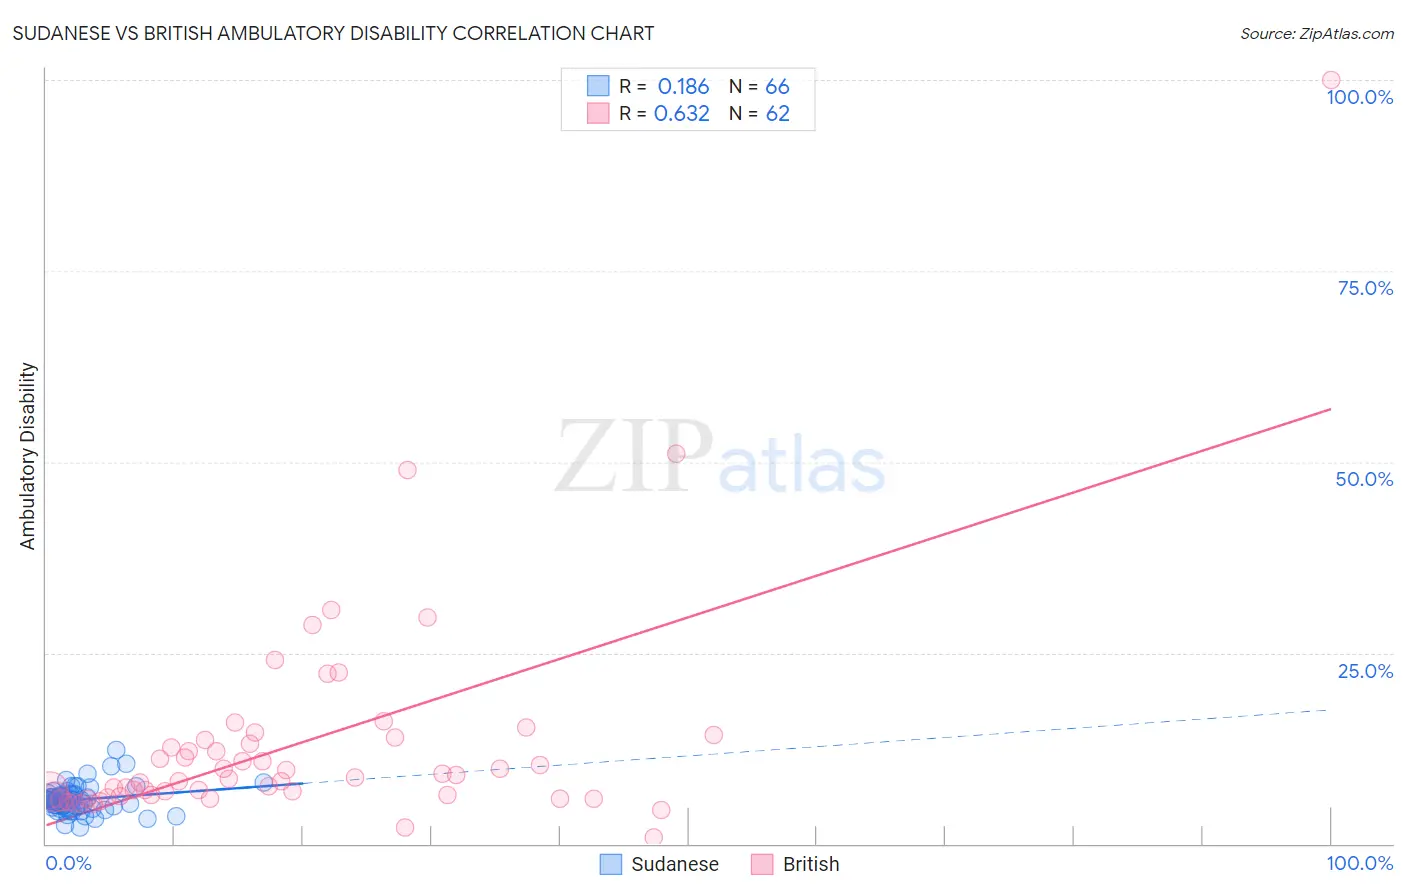
Sudanese vs British Ambulatory Disability Correlation Chart
The statistical analysis conducted on geographies consisting of 110,129,493 people shows a poor positive correlation between the proportion of Sudanese and percentage of population with ambulatory disability in the United States with a correlation coefficient (R) of 0.186 and weighted average of 5.7%. Similarly, the statistical analysis conducted on geographies consisting of 531,154,282 people shows a significant positive correlation between the proportion of British and percentage of population with ambulatory disability in the United States with a correlation coefficient (R) of 0.632 and weighted average of 6.2%, a difference of 8.0%.
Ambulatory Disability Correlation Summary
| Measurement | Sudanese | British |
| Minimum | 2.1% | 0.87% |
| Maximum | 12.3% | 100.0% |
| Range | 10.2% | 99.1% |
| Mean | 5.8% | 13.1% |
| Median | 5.6% | 8.6% |
| Interquartile 25% (IQ1) | 4.8% | 6.3% |
| Interquartile 75% (IQ3) | 6.3% | 13.6% |
| Interquartile Range (IQR) | 1.5% | 7.3% |
| Standard Deviation (Sample) | 1.8% | 14.6% |
| Standard Deviation (Population) | 1.7% | 14.5% |
Similar Demographics by Ambulatory Disability
Demographics Similar to Sudanese by Ambulatory Disability
In terms of ambulatory disability, the demographic groups most similar to Sudanese are Immigrants from South Africa (5.7%, a difference of 0.020%), Immigrants from Cameroon (5.7%, a difference of 0.070%), Immigrants from Northern Africa (5.7%, a difference of 0.080%), Brazilian (5.7%, a difference of 0.090%), and Immigrants from Peru (5.7%, a difference of 0.12%).
| Demographics | Rating | Rank | Ambulatory Disability |
| Peruvians | 99.5 /100 | #69 | Exceptional 5.7% |
| Sierra Leoneans | 99.4 /100 | #70 | Exceptional 5.7% |
| Immigrants | Peru | 99.4 /100 | #71 | Exceptional 5.7% |
| Brazilians | 99.4 /100 | #72 | Exceptional 5.7% |
| Immigrants | Northern Africa | 99.4 /100 | #73 | Exceptional 5.7% |
| Immigrants | Cameroon | 99.4 /100 | #74 | Exceptional 5.7% |
| Immigrants | South Africa | 99.3 /100 | #75 | Exceptional 5.7% |
| Sudanese | 99.3 /100 | #76 | Exceptional 5.7% |
| Immigrants | Vietnam | 99.3 /100 | #77 | Exceptional 5.7% |
| Somalis | 99.2 /100 | #78 | Exceptional 5.7% |
| Chileans | 99.2 /100 | #79 | Exceptional 5.7% |
| Immigrants | Ireland | 99.2 /100 | #80 | Exceptional 5.7% |
| Immigrants | Jordan | 99.2 /100 | #81 | Exceptional 5.7% |
| Palestinians | 99.2 /100 | #82 | Exceptional 5.7% |
| Eastern Europeans | 99.2 /100 | #83 | Exceptional 5.7% |
Demographics Similar to British by Ambulatory Disability
In terms of ambulatory disability, the demographic groups most similar to British are Ukrainian (6.2%, a difference of 0.020%), Immigrants from Western Africa (6.2%, a difference of 0.050%), Carpatho Rusyn (6.2%, a difference of 0.060%), European (6.2%, a difference of 0.11%), and Immigrants from Guatemala (6.2%, a difference of 0.14%).
| Demographics | Rating | Rank | Ambulatory Disability |
| Swiss | 43.1 /100 | #181 | Average 6.1% |
| Serbians | 42.8 /100 | #182 | Average 6.1% |
| Immigrants | Thailand | 42.2 /100 | #183 | Average 6.1% |
| Immigrants | Ghana | 41.2 /100 | #184 | Average 6.1% |
| Immigrants | Bosnia and Herzegovina | 37.2 /100 | #185 | Fair 6.2% |
| Europeans | 36.2 /100 | #186 | Fair 6.2% |
| Carpatho Rusyns | 35.3 /100 | #187 | Fair 6.2% |
| British | 34.3 /100 | #188 | Fair 6.2% |
| Ukrainians | 34.0 /100 | #189 | Fair 6.2% |
| Immigrants | Western Africa | 33.4 /100 | #190 | Fair 6.2% |
| Immigrants | Guatemala | 31.9 /100 | #191 | Fair 6.2% |
| Immigrants | Western Europe | 31.6 /100 | #192 | Fair 6.2% |
| Guatemalans | 30.0 /100 | #193 | Fair 6.2% |
| Alaska Natives | 29.8 /100 | #194 | Fair 6.2% |
| Belgians | 28.6 /100 | #195 | Fair 6.2% |