German Russian vs Immigrants from Bolivia Ambulatory Disability
COMPARE
German Russian
Immigrants from Bolivia
Ambulatory Disability
Ambulatory Disability Comparison
German Russians
Immigrants from Bolivia
6.3%
AMBULATORY DISABILITY
9.4/ 100
METRIC RATING
222nd/ 347
METRIC RANK
5.0%
AMBULATORY DISABILITY
100.0/ 100
METRIC RATING
6th/ 347
METRIC RANK
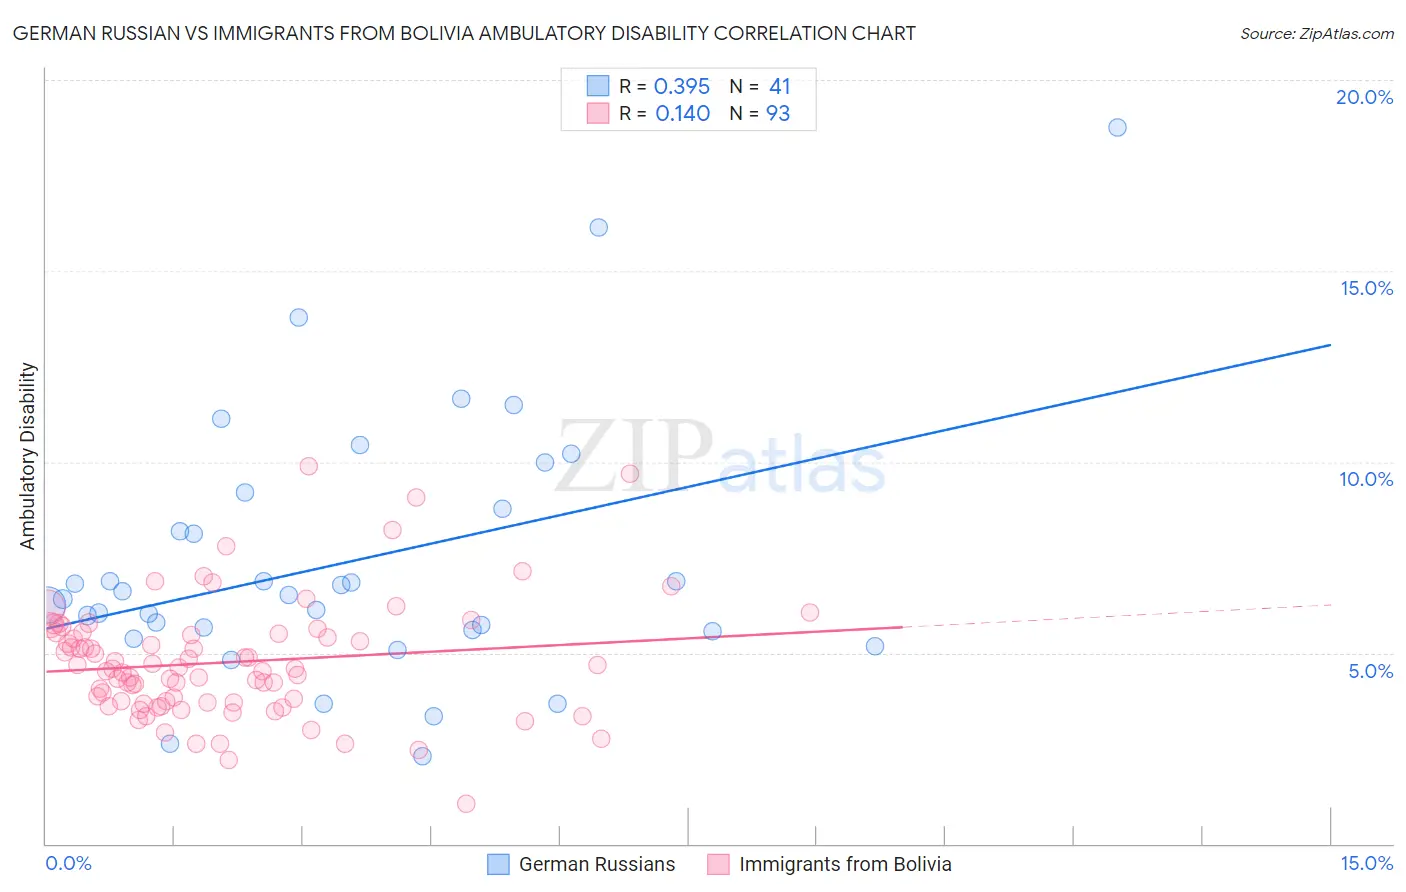
German Russian vs Immigrants from Bolivia Ambulatory Disability Correlation Chart
The statistical analysis conducted on geographies consisting of 96,455,793 people shows a mild positive correlation between the proportion of German Russians and percentage of population with ambulatory disability in the United States with a correlation coefficient (R) of 0.395 and weighted average of 6.3%. Similarly, the statistical analysis conducted on geographies consisting of 158,713,852 people shows a poor positive correlation between the proportion of Immigrants from Bolivia and percentage of population with ambulatory disability in the United States with a correlation coefficient (R) of 0.140 and weighted average of 5.0%, a difference of 25.1%.
Ambulatory Disability Correlation Summary
| Measurement | German Russian | Immigrants from Bolivia |
| Minimum | 2.3% | 1.0% |
| Maximum | 18.8% | 9.9% |
| Range | 16.5% | 8.8% |
| Mean | 7.4% | 4.8% |
| Median | 6.5% | 4.6% |
| Interquartile 25% (IQ1) | 5.6% | 3.7% |
| Interquartile 75% (IQ3) | 9.0% | 5.5% |
| Interquartile Range (IQR) | 3.4% | 1.8% |
| Standard Deviation (Sample) | 3.4% | 1.5% |
| Standard Deviation (Population) | 3.4% | 1.5% |
Similar Demographics by Ambulatory Disability
Demographics Similar to German Russians by Ambulatory Disability
In terms of ambulatory disability, the demographic groups most similar to German Russians are Immigrants from Albania (6.3%, a difference of 0.030%), Hungarian (6.3%, a difference of 0.030%), Indonesian (6.3%, a difference of 0.070%), Guamanian/Chamorro (6.3%, a difference of 0.17%), and Canadian (6.3%, a difference of 0.21%).
| Demographics | Rating | Rank | Ambulatory Disability |
| Immigrants | Latin America | 11.0 /100 | #215 | Poor 6.3% |
| Canadians | 10.9 /100 | #216 | Poor 6.3% |
| Yugoslavians | 10.9 /100 | #217 | Poor 6.3% |
| Guamanians/Chamorros | 10.6 /100 | #218 | Poor 6.3% |
| Indonesians | 9.9 /100 | #219 | Tragic 6.3% |
| Immigrants | Albania | 9.6 /100 | #220 | Tragic 6.3% |
| Hungarians | 9.6 /100 | #221 | Tragic 6.3% |
| German Russians | 9.4 /100 | #222 | Tragic 6.3% |
| Immigrants | Honduras | 7.6 /100 | #223 | Tragic 6.3% |
| Liberians | 7.1 /100 | #224 | Tragic 6.3% |
| Hondurans | 6.3 /100 | #225 | Tragic 6.3% |
| Slavs | 5.1 /100 | #226 | Tragic 6.4% |
| Cubans | 4.0 /100 | #227 | Tragic 6.4% |
| Portuguese | 4.0 /100 | #228 | Tragic 6.4% |
| Czechoslovakians | 3.8 /100 | #229 | Tragic 6.4% |
Demographics Similar to Immigrants from Bolivia by Ambulatory Disability
In terms of ambulatory disability, the demographic groups most similar to Immigrants from Bolivia are Bolivian (5.1%, a difference of 0.38%), Immigrants from Singapore (5.0%, a difference of 0.68%), Immigrants from South Central Asia (5.1%, a difference of 1.4%), Iranian (5.1%, a difference of 1.7%), and Immigrants from Taiwan (4.9%, a difference of 2.1%).
| Demographics | Rating | Rank | Ambulatory Disability |
| Immigrants | India | 100.0 /100 | #1 | Exceptional 4.8% |
| Filipinos | 100.0 /100 | #2 | Exceptional 4.9% |
| Thais | 100.0 /100 | #3 | Exceptional 4.9% |
| Immigrants | Taiwan | 100.0 /100 | #4 | Exceptional 4.9% |
| Immigrants | Singapore | 100.0 /100 | #5 | Exceptional 5.0% |
| Immigrants | Bolivia | 100.0 /100 | #6 | Exceptional 5.0% |
| Bolivians | 100.0 /100 | #7 | Exceptional 5.1% |
| Immigrants | South Central Asia | 100.0 /100 | #8 | Exceptional 5.1% |
| Iranians | 100.0 /100 | #9 | Exceptional 5.1% |
| Yup'ik | 100.0 /100 | #10 | Exceptional 5.2% |
| Immigrants | Korea | 100.0 /100 | #11 | Exceptional 5.2% |
| Okinawans | 100.0 /100 | #12 | Exceptional 5.3% |
| Burmese | 100.0 /100 | #13 | Exceptional 5.3% |
| Immigrants | Eastern Asia | 100.0 /100 | #14 | Exceptional 5.3% |
| Immigrants | China | 100.0 /100 | #15 | Exceptional 5.3% |