Subsaharan African vs Bolivian Disability Age 35 to 64
COMPARE
Subsaharan African
Bolivian
Disability Age 35 to 64
Disability Age 35 to 64 Comparison
Sub-Saharan Africans
Bolivians
12.6%
DISABILITY AGE 35 TO 64
0.2/ 100
METRIC RATING
267th/ 347
METRIC RANK
8.9%
DISABILITY AGE 35 TO 64
100.0/ 100
METRIC RATING
15th/ 347
METRIC RANK
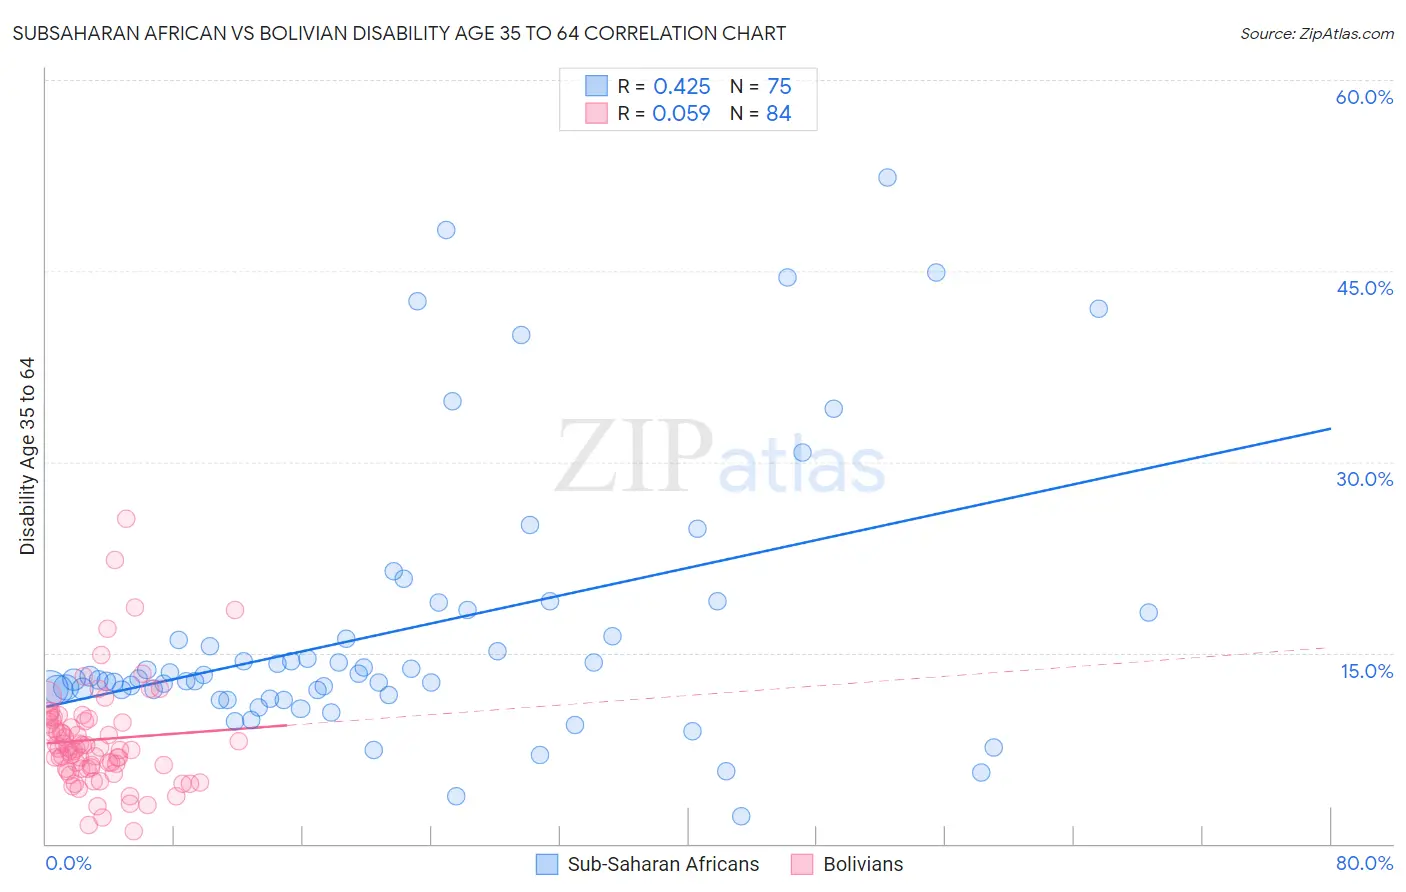
Subsaharan African vs Bolivian Disability Age 35 to 64 Correlation Chart
The statistical analysis conducted on geographies consisting of 507,479,662 people shows a moderate positive correlation between the proportion of Sub-Saharan Africans and percentage of population with a disability between the ages 34 and 64 in the United States with a correlation coefficient (R) of 0.425 and weighted average of 12.6%. Similarly, the statistical analysis conducted on geographies consisting of 184,604,467 people shows a slight positive correlation between the proportion of Bolivians and percentage of population with a disability between the ages 34 and 64 in the United States with a correlation coefficient (R) of 0.059 and weighted average of 8.9%, a difference of 41.4%.
Disability Age 35 to 64 Correlation Summary
| Measurement | Subsaharan African | Bolivian |
| Minimum | 2.2% | 1.0% |
| Maximum | 52.4% | 25.5% |
| Range | 50.2% | 24.5% |
| Mean | 16.8% | 8.2% |
| Median | 12.9% | 7.5% |
| Interquartile 25% (IQ1) | 11.6% | 5.9% |
| Interquartile 75% (IQ3) | 18.2% | 9.7% |
| Interquartile Range (IQR) | 6.5% | 3.8% |
| Standard Deviation (Sample) | 10.7% | 4.1% |
| Standard Deviation (Population) | 10.7% | 4.1% |
Similar Demographics by Disability Age 35 to 64
Demographics Similar to Sub-Saharan Africans by Disability Age 35 to 64
In terms of disability age 35 to 64, the demographic groups most similar to Sub-Saharan Africans are White/Caucasian (12.6%, a difference of 0.16%), Immigrants from Dominica (12.7%, a difference of 0.18%), Spanish (12.7%, a difference of 0.28%), French (12.7%, a difference of 0.33%), and Marshallese (12.5%, a difference of 0.86%).
| Demographics | Rating | Rank | Disability Age 35 to 64 |
| German Russians | 0.5 /100 | #260 | Tragic 12.5% |
| Malaysians | 0.5 /100 | #261 | Tragic 12.5% |
| Senegalese | 0.5 /100 | #262 | Tragic 12.5% |
| Immigrants | Zaire | 0.4 /100 | #263 | Tragic 12.5% |
| Immigrants | Portugal | 0.4 /100 | #264 | Tragic 12.5% |
| Marshallese | 0.4 /100 | #265 | Tragic 12.5% |
| Whites/Caucasians | 0.3 /100 | #266 | Tragic 12.6% |
| Sub-Saharan Africans | 0.2 /100 | #267 | Tragic 12.6% |
| Immigrants | Dominica | 0.2 /100 | #268 | Tragic 12.7% |
| Spanish | 0.2 /100 | #269 | Tragic 12.7% |
| French | 0.2 /100 | #270 | Tragic 12.7% |
| Nepalese | 0.1 /100 | #271 | Tragic 12.8% |
| U.S. Virgin Islanders | 0.1 /100 | #272 | Tragic 12.8% |
| Pennsylvania Germans | 0.1 /100 | #273 | Tragic 12.8% |
| Celtics | 0.1 /100 | #274 | Tragic 12.9% |
Demographics Similar to Bolivians by Disability Age 35 to 64
In terms of disability age 35 to 64, the demographic groups most similar to Bolivians are Immigrants from Singapore (8.9%, a difference of 0.29%), Immigrants from Korea (9.0%, a difference of 0.34%), Immigrants from South Central Asia (8.9%, a difference of 0.89%), Indian (Asian) (8.9%, a difference of 0.98%), and Immigrants from Eastern Asia (8.8%, a difference of 1.8%).
| Demographics | Rating | Rank | Disability Age 35 to 64 |
| Iranians | 100.0 /100 | #8 | Exceptional 8.7% |
| Immigrants | China | 100.0 /100 | #9 | Exceptional 8.7% |
| Immigrants | Bolivia | 100.0 /100 | #10 | Exceptional 8.7% |
| Immigrants | Eastern Asia | 100.0 /100 | #11 | Exceptional 8.8% |
| Indians (Asian) | 100.0 /100 | #12 | Exceptional 8.9% |
| Immigrants | South Central Asia | 100.0 /100 | #13 | Exceptional 8.9% |
| Immigrants | Singapore | 100.0 /100 | #14 | Exceptional 8.9% |
| Bolivians | 100.0 /100 | #15 | Exceptional 8.9% |
| Immigrants | Korea | 100.0 /100 | #16 | Exceptional 9.0% |
| Burmese | 100.0 /100 | #17 | Exceptional 9.2% |
| Soviet Union | 100.0 /100 | #18 | Exceptional 9.2% |
| Immigrants | Venezuela | 100.0 /100 | #19 | Exceptional 9.3% |
| Immigrants | Argentina | 100.0 /100 | #20 | Exceptional 9.3% |
| Okinawans | 100.0 /100 | #21 | Exceptional 9.4% |
| Cypriots | 100.0 /100 | #22 | Exceptional 9.4% |