Luxembourger vs Cree Disability Age 35 to 64
COMPARE
Luxembourger
Cree
Disability Age 35 to 64
Disability Age 35 to 64 Comparison
Luxembourgers
Cree
10.6%
DISABILITY AGE 35 TO 64
95.5/ 100
METRIC RATING
119th/ 347
METRIC RANK
14.1%
DISABILITY AGE 35 TO 64
0.0/ 100
METRIC RATING
309th/ 347
METRIC RANK
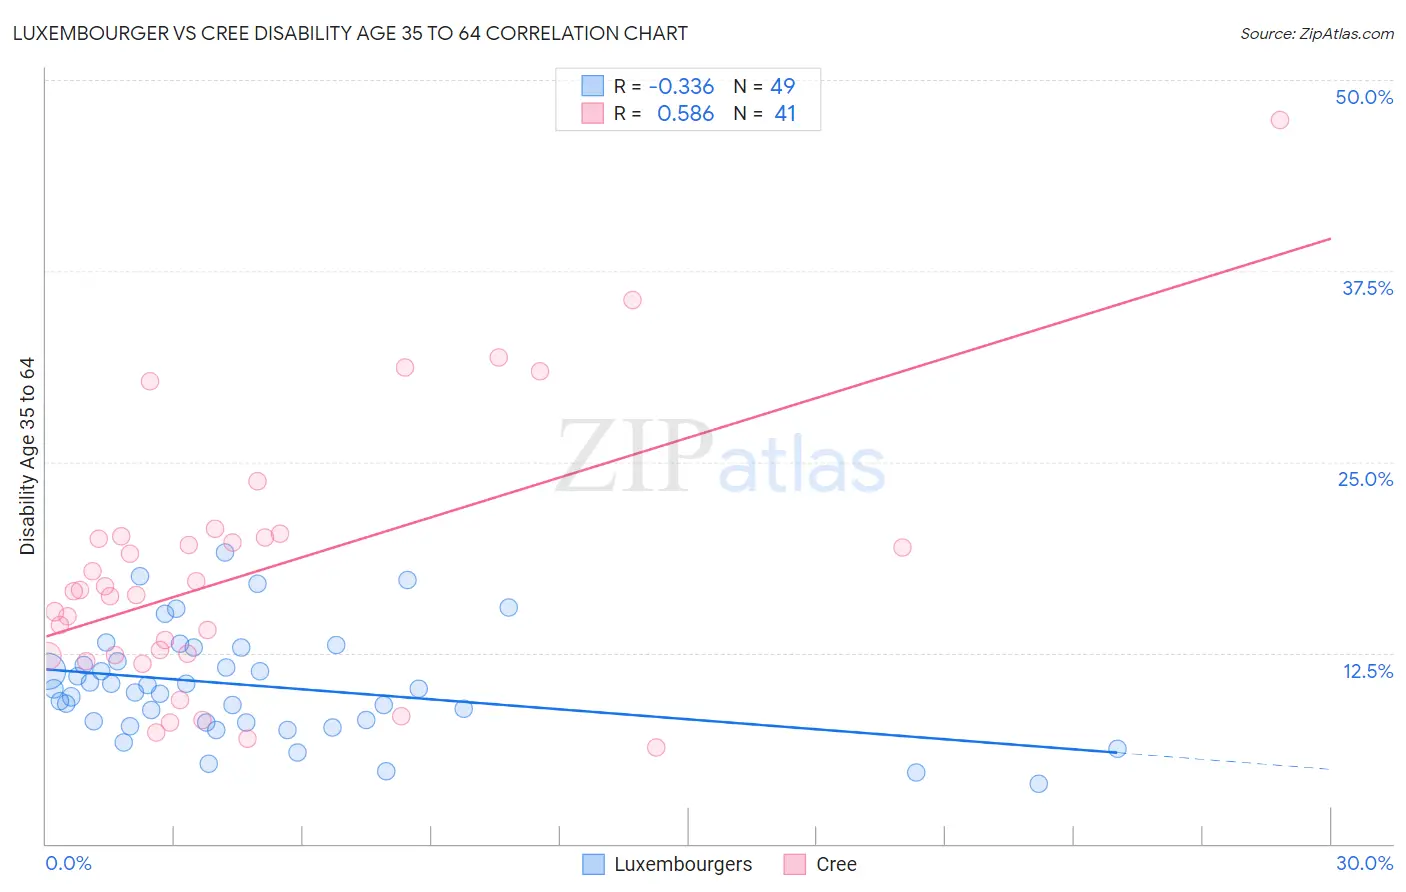
Luxembourger vs Cree Disability Age 35 to 64 Correlation Chart
The statistical analysis conducted on geographies consisting of 144,643,404 people shows a mild negative correlation between the proportion of Luxembourgers and percentage of population with a disability between the ages 34 and 64 in the United States with a correlation coefficient (R) of -0.336 and weighted average of 10.6%. Similarly, the statistical analysis conducted on geographies consisting of 76,205,381 people shows a substantial positive correlation between the proportion of Cree and percentage of population with a disability between the ages 34 and 64 in the United States with a correlation coefficient (R) of 0.586 and weighted average of 14.1%, a difference of 33.0%.
Disability Age 35 to 64 Correlation Summary
| Measurement | Luxembourger | Cree |
| Minimum | 3.9% | 6.3% |
| Maximum | 19.1% | 47.4% |
| Range | 15.1% | 41.1% |
| Mean | 10.3% | 17.7% |
| Median | 10.1% | 16.5% |
| Interquartile 25% (IQ1) | 7.9% | 12.3% |
| Interquartile 75% (IQ3) | 12.4% | 20.1% |
| Interquartile Range (IQR) | 4.4% | 7.8% |
| Standard Deviation (Sample) | 3.5% | 8.6% |
| Standard Deviation (Population) | 3.4% | 8.5% |
Similar Demographics by Disability Age 35 to 64
Demographics Similar to Luxembourgers by Disability Age 35 to 64
In terms of disability age 35 to 64, the demographic groups most similar to Luxembourgers are Vietnamese (10.6%, a difference of 0.020%), Immigrants from Moldova (10.6%, a difference of 0.050%), Immigrants from South Eastern Asia (10.6%, a difference of 0.14%), Romanian (10.6%, a difference of 0.19%), and Immigrants from Norway (10.6%, a difference of 0.22%).
| Demographics | Rating | Rank | Disability Age 35 to 64 |
| Assyrians/Chaldeans/Syriacs | 96.8 /100 | #112 | Exceptional 10.5% |
| Tongans | 96.6 /100 | #113 | Exceptional 10.5% |
| Immigrants | Morocco | 96.6 /100 | #114 | Exceptional 10.5% |
| Immigrants | Netherlands | 96.3 /100 | #115 | Exceptional 10.5% |
| Immigrants | Nepal | 95.9 /100 | #116 | Exceptional 10.6% |
| Immigrants | South Eastern Asia | 95.7 /100 | #117 | Exceptional 10.6% |
| Immigrants | Moldova | 95.5 /100 | #118 | Exceptional 10.6% |
| Luxembourgers | 95.5 /100 | #119 | Exceptional 10.6% |
| Vietnamese | 95.4 /100 | #120 | Exceptional 10.6% |
| Romanians | 95.0 /100 | #121 | Exceptional 10.6% |
| Immigrants | Norway | 95.0 /100 | #122 | Exceptional 10.6% |
| Maltese | 94.8 /100 | #123 | Exceptional 10.6% |
| Estonians | 94.5 /100 | #124 | Exceptional 10.6% |
| Albanians | 94.2 /100 | #125 | Exceptional 10.6% |
| Immigrants | Afghanistan | 94.1 /100 | #126 | Exceptional 10.6% |
Demographics Similar to Cree by Disability Age 35 to 64
In terms of disability age 35 to 64, the demographic groups most similar to Cree are Inupiat (14.1%, a difference of 0.070%), Blackfeet (14.1%, a difference of 0.10%), Immigrants from Yemen (14.0%, a difference of 0.26%), Cape Verdean (14.1%, a difference of 0.47%), and American (13.9%, a difference of 1.1%).
| Demographics | Rating | Rank | Disability Age 35 to 64 |
| Aleuts | 0.0 /100 | #302 | Tragic 13.8% |
| Sioux | 0.0 /100 | #303 | Tragic 13.9% |
| Hopi | 0.0 /100 | #304 | Tragic 13.9% |
| Americans | 0.0 /100 | #305 | Tragic 13.9% |
| Immigrants | Yemen | 0.0 /100 | #306 | Tragic 14.0% |
| Blackfeet | 0.0 /100 | #307 | Tragic 14.1% |
| Inupiat | 0.0 /100 | #308 | Tragic 14.1% |
| Cree | 0.0 /100 | #309 | Tragic 14.1% |
| Cape Verdeans | 0.0 /100 | #310 | Tragic 14.1% |
| Immigrants | Azores | 0.0 /100 | #311 | Tragic 14.3% |
| Paiute | 0.0 /100 | #312 | Tragic 14.3% |
| Iroquois | 0.0 /100 | #313 | Tragic 14.4% |
| Shoshone | 0.0 /100 | #314 | Tragic 14.5% |
| Alaska Natives | 0.0 /100 | #315 | Tragic 14.5% |
| Osage | 0.0 /100 | #316 | Tragic 14.5% |