Immigrants from Oceania vs Comanche Hearing Disability
COMPARE
Immigrants from Oceania
Comanche
Hearing Disability
Hearing Disability Comparison
Immigrants from Oceania
Comanche
3.2%
HEARING DISABILITY
6.5/ 100
METRIC RATING
222nd/ 347
METRIC RANK
4.0%
HEARING DISABILITY
0.0/ 100
METRIC RATING
317th/ 347
METRIC RANK
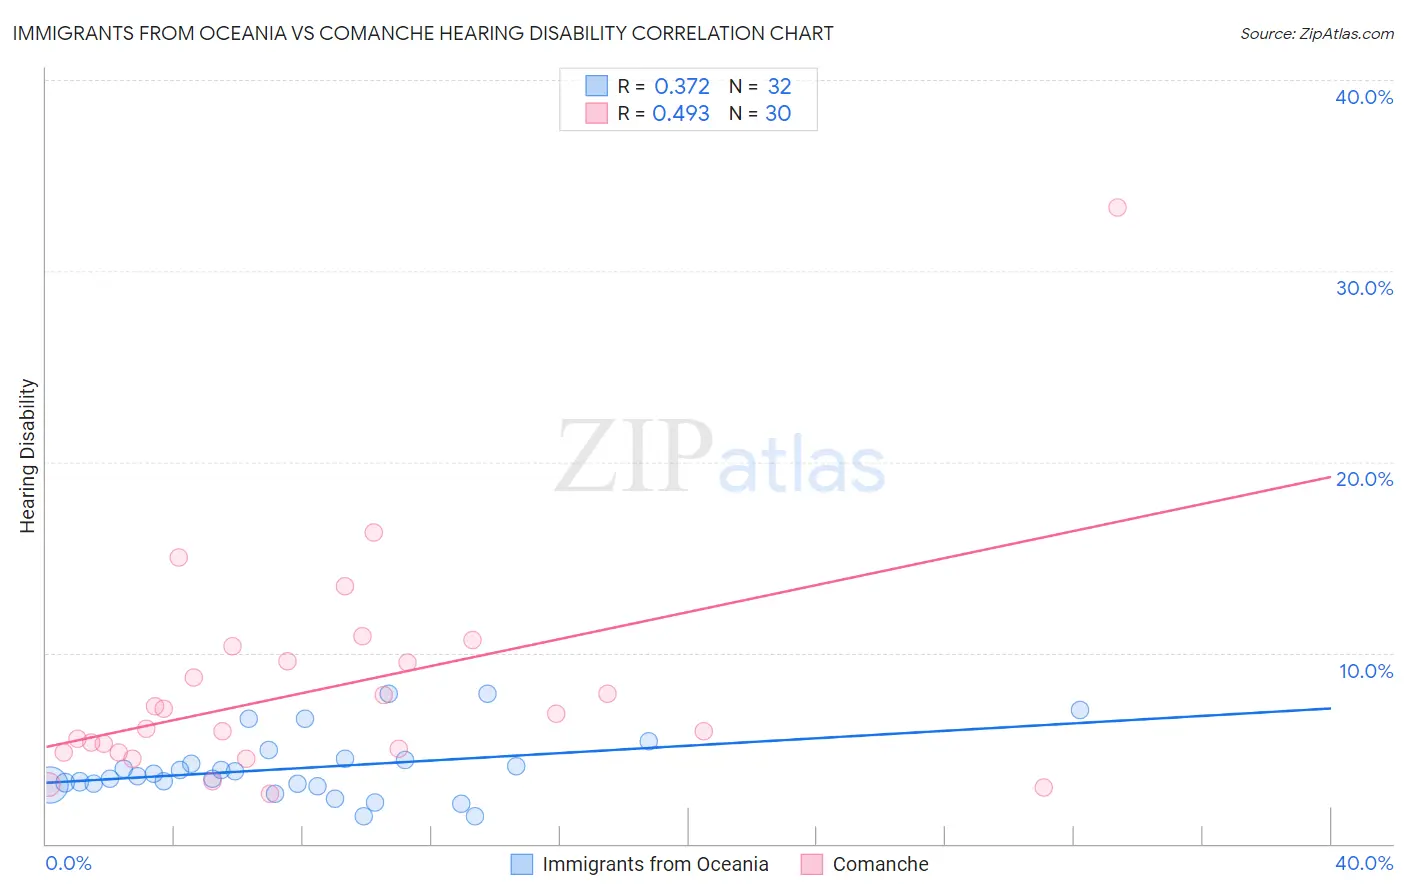
Immigrants from Oceania vs Comanche Hearing Disability Correlation Chart
The statistical analysis conducted on geographies consisting of 305,402,457 people shows a mild positive correlation between the proportion of Immigrants from Oceania and percentage of population with hearing disability in the United States with a correlation coefficient (R) of 0.372 and weighted average of 3.2%. Similarly, the statistical analysis conducted on geographies consisting of 109,751,188 people shows a moderate positive correlation between the proportion of Comanche and percentage of population with hearing disability in the United States with a correlation coefficient (R) of 0.493 and weighted average of 4.0%, a difference of 24.5%.
Hearing Disability Correlation Summary
| Measurement | Immigrants from Oceania | Comanche |
| Minimum | 1.4% | 2.6% |
| Maximum | 7.9% | 33.3% |
| Range | 6.5% | 30.7% |
| Mean | 4.0% | 8.1% |
| Median | 3.6% | 6.4% |
| Interquartile 25% (IQ1) | 3.1% | 4.8% |
| Interquartile 75% (IQ3) | 4.4% | 9.6% |
| Interquartile Range (IQR) | 1.3% | 4.8% |
| Standard Deviation (Sample) | 1.7% | 5.9% |
| Standard Deviation (Population) | 1.6% | 5.8% |
Similar Demographics by Hearing Disability
Demographics Similar to Immigrants from Oceania by Hearing Disability
In terms of hearing disability, the demographic groups most similar to Immigrants from Oceania are Malaysian (3.2%, a difference of 0.040%), Immigrants from Laos (3.2%, a difference of 0.040%), New Zealander (3.2%, a difference of 0.10%), Immigrants from Northern Europe (3.2%, a difference of 0.16%), and Russian (3.2%, a difference of 0.20%).
| Demographics | Rating | Rank | Hearing Disability |
| Bangladeshis | 8.1 /100 | #215 | Tragic 3.2% |
| Immigrants | Norway | 7.3 /100 | #216 | Tragic 3.2% |
| Russians | 7.1 /100 | #217 | Tragic 3.2% |
| Immigrants | Northern Europe | 7.0 /100 | #218 | Tragic 3.2% |
| New Zealanders | 6.8 /100 | #219 | Tragic 3.2% |
| Malaysians | 6.6 /100 | #220 | Tragic 3.2% |
| Immigrants | Laos | 6.6 /100 | #221 | Tragic 3.2% |
| Immigrants | Oceania | 6.5 /100 | #222 | Tragic 3.2% |
| Mexicans | 5.6 /100 | #223 | Tragic 3.2% |
| Icelanders | 5.2 /100 | #224 | Tragic 3.2% |
| Latvians | 5.1 /100 | #225 | Tragic 3.2% |
| Lebanese | 5.0 /100 | #226 | Tragic 3.2% |
| Bhutanese | 4.6 /100 | #227 | Tragic 3.2% |
| Immigrants | Portugal | 4.3 /100 | #228 | Tragic 3.2% |
| Maltese | 4.1 /100 | #229 | Tragic 3.2% |
Demographics Similar to Comanche by Hearing Disability
In terms of hearing disability, the demographic groups most similar to Comanche are Spanish American (4.0%, a difference of 0.13%), Cheyenne (4.0%, a difference of 0.17%), Puget Sound Salish (3.9%, a difference of 0.33%), Yakama (3.9%, a difference of 0.34%), and Hopi (3.9%, a difference of 0.51%).
| Demographics | Rating | Rank | Hearing Disability |
| Cree | 0.0 /100 | #310 | Tragic 3.8% |
| Americans | 0.0 /100 | #311 | Tragic 3.9% |
| Cajuns | 0.0 /100 | #312 | Tragic 3.9% |
| Hopi | 0.0 /100 | #313 | Tragic 3.9% |
| Yakama | 0.0 /100 | #314 | Tragic 3.9% |
| Puget Sound Salish | 0.0 /100 | #315 | Tragic 3.9% |
| Spanish Americans | 0.0 /100 | #316 | Tragic 4.0% |
| Comanche | 0.0 /100 | #317 | Tragic 4.0% |
| Cheyenne | 0.0 /100 | #318 | Tragic 4.0% |
| Chippewa | 0.0 /100 | #319 | Tragic 4.0% |
| Shoshone | 0.0 /100 | #320 | Tragic 4.0% |
| Paiute | 0.0 /100 | #321 | Tragic 4.1% |
| Seminole | 0.0 /100 | #322 | Tragic 4.1% |
| Apache | 0.0 /100 | #323 | Tragic 4.1% |
| Osage | 0.0 /100 | #324 | Tragic 4.1% |